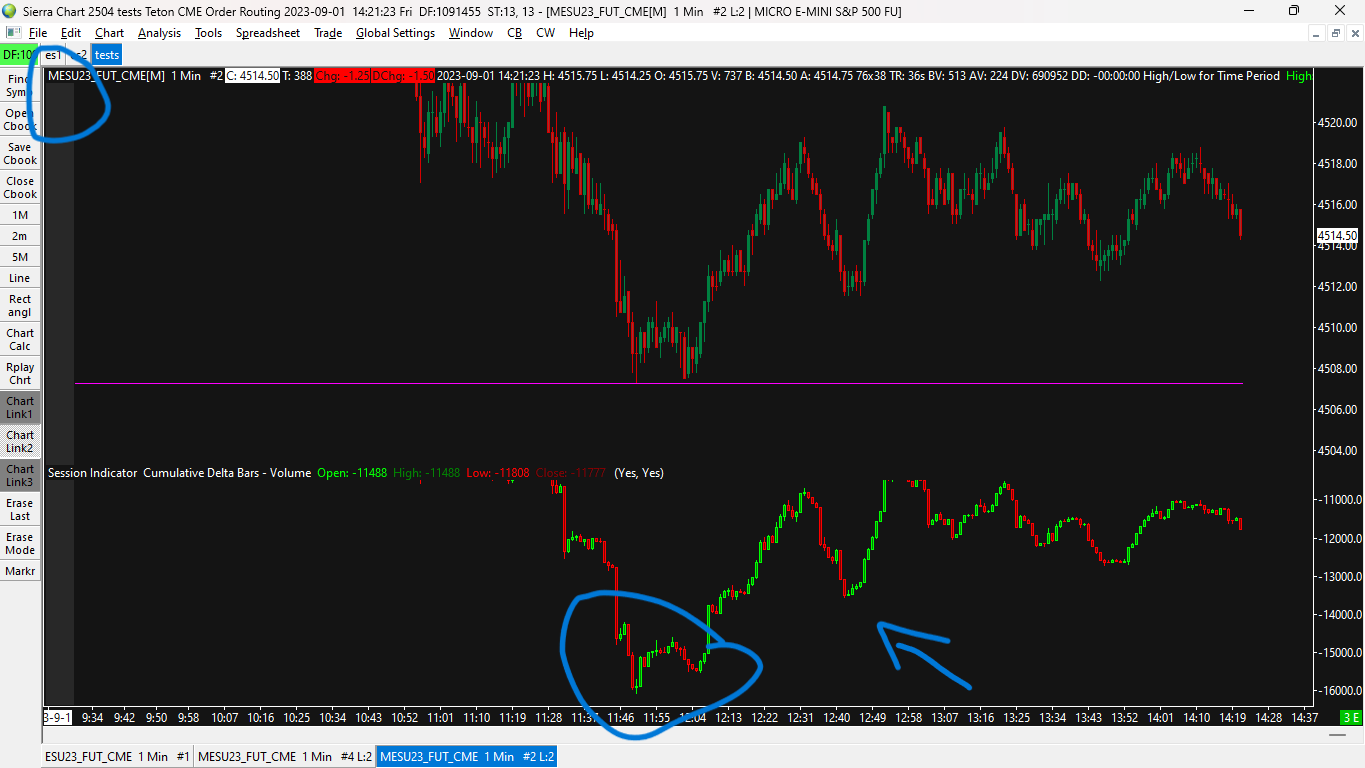
I short term trade futures markets, and I use the DOM (depth of market) and various volume indicators, like cumulative delta, and footprint charts. I used to trade MES, but I switched over to ES, and I realized that the volume indicators do not show a mirrored proportional image.
Let me elaborate. The cumulative delta indicator shows the difference between the total market buy orders and market sell orders. And some of my trading decisions are based off of what this indicator shows me; absorption or exhaustion. And I realized that on the same day, ES showed that at a particular moment, sellers where absorbed. Yet on MES, which is the exact same market, just a micro version of it, showed exhaustion of sellers. Literally the exact opposite. And I further looked into this, and I found differences like this everywhere, every day. But this is a huge problem, as one market could show strong support, but the other would show strong resistance. And as I analyse the market through orderflow, this threw me off my game.
This leads me to two questions, how reliable is orderflow when trading, and also why does this happen?
I put two screenshots, one of MES, and one of ES, on a 1 minute chart, and the indicator on the bottom is the cumulative delta indicator. Look at how different they are.enter image description here

