2
$\begingroup$

Under the CEV model the stock price has the following dynamics:

$dS_t=\mu S_tdt+\sigma S_t^\gamma dW_t$, where $\sigma\geq0, $ $\gamma\geq0$.

According to Wikipedia, if $\gamma <1$ the volatility of the stock increases as the price falls.

But why is this true? Shouldn't be the exponent negative in order to have an inverse relationship between stock price and the volatility term?

$\endgroup$

2 Answers 2

4
$\begingroup$

Note that \begin{align*} dS_t = S_t\left(\mu dt+\sigma S_t^{\gamma-1} dW_t \right). \end{align*} That is, the volatility function is defined by $\sigma S_t^{\gamma-1}$. Then, if $\gamma <1$, the volatility increases as the price falls.

$\endgroup$
0
$\begingroup$

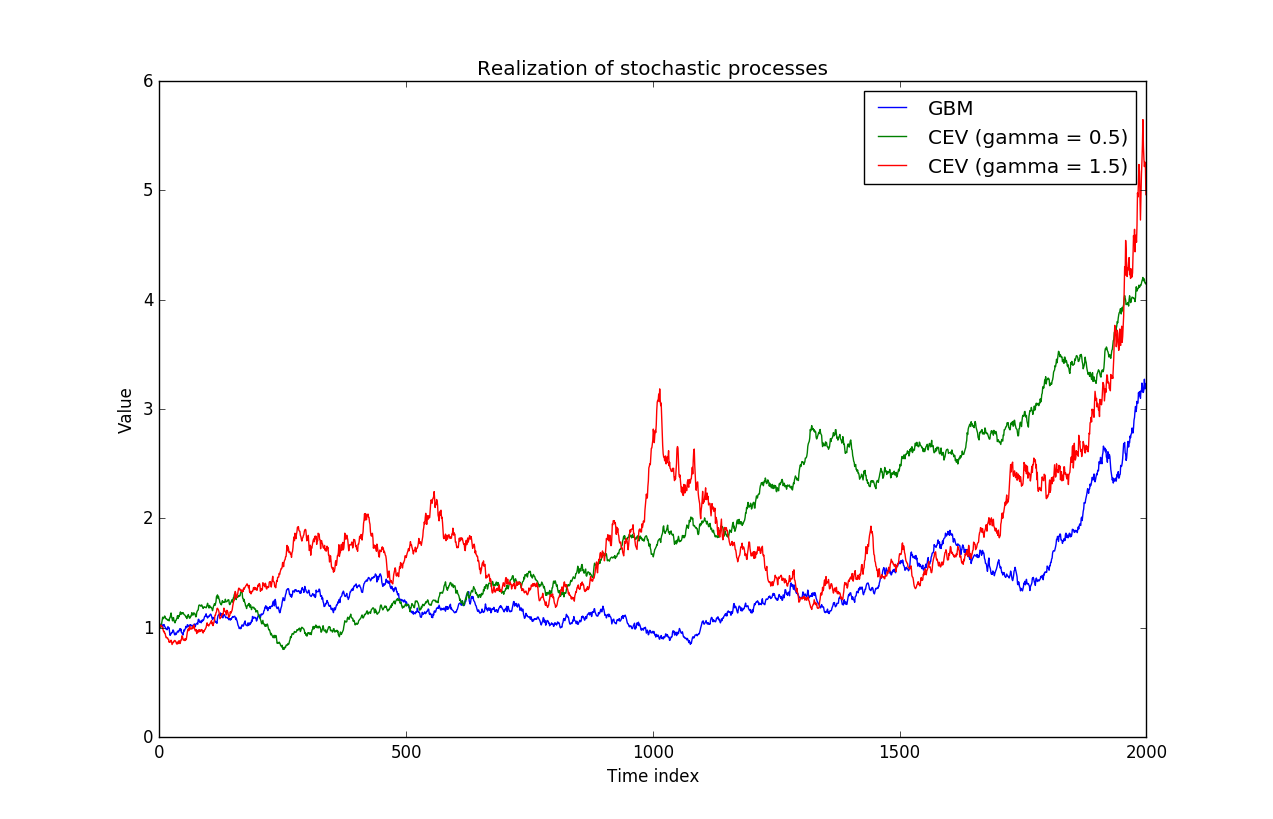
On top of @Gordon answers which gives the mathematical reason of why this happens, have a look at the graph below which illustrates the behavior of the CEV process for various values of $\gamma$.

As you can see, a low $\gamma$ looks like a constant volatility for high prices (similar to a brownian motion with drift) while a high value of $\gamma$ shows high volatilities for high prices.

Illustration of various CEV processes

Source : estimating a CEV model.

$\endgroup$

Your Answer

By clicking “Post Your Answer”, you agree to our terms of service and acknowledge you have read our privacy policy.

Not the answer you're looking for? Browse other questions tagged or ask your own question.