3
$\begingroup$

Assuming the market is perfect liquid, the bond price can be replicated and is related as follows:

$$\sum_{t=0}^{N}c_ne^{-Y(t_n-t)}=\sum_{t=0}^{N}c_nP_{t_n}=\sum_{t=0}^{N}c_ne^{-Y_{t,t_n}(t_n-t)}$$

The $P_{t_n}$ denotes the ask price of a zero coupon bond at maturity $t_n$ and $c_n$ corresponding payment of the bond at time $t_n$. $Y$ is the yield to maturity and $Y_{t,t_n}$ the yield curve. The idea is just to replicate the payment of bond by zero coupon bond at different maturity.

Question: Why does this equation holds only under assumption of perfect liquid market? What would change if we are in a illiquid market?

$\endgroup$

2 Answers 2

4
$\begingroup$

In practice, this equation won't even hold for the vast majority of bonds in the US Treasury market, which is the most liquid government bond market.

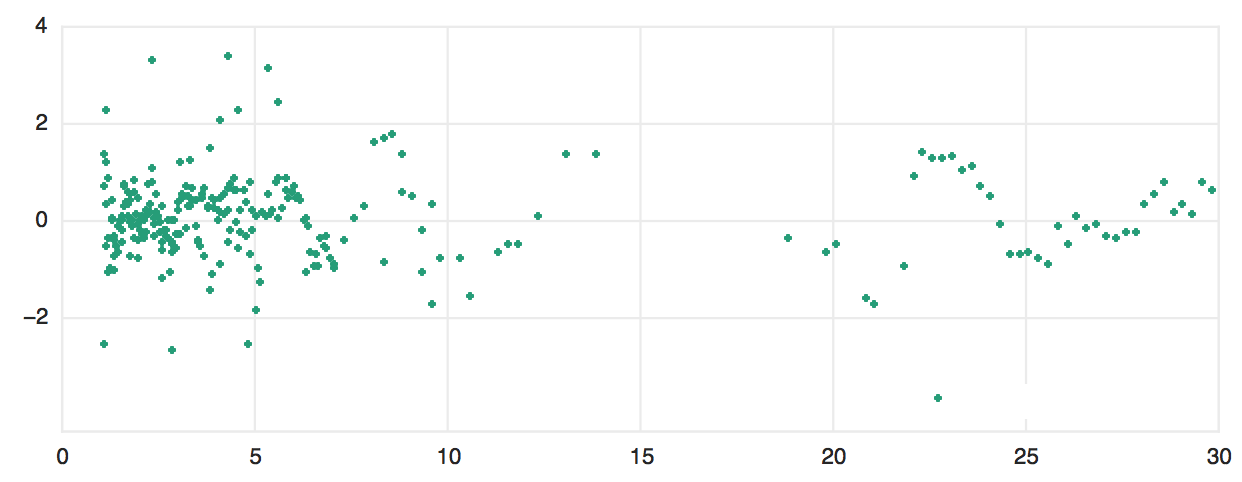
The chart below shows the spreads of US Treasuries relative to a fitted curve (more specifically, a model price is calculated for each bond by discounting its cash flows using a theoretical zero coupon curve. The difference between the model yield and the market quoted yield is shown in the chart):
enter image description here

As you can see, nearly all Treasuries trade at a small spread to the theoretical yield curve. These spreads change over time, providing a lot of relative value trading opportunities. Relevant to your question, these spreads don't always exist because of liquidity reasons. For example, some bonds might trade rich relative to their theoretical values, because they're trading special in the repo market ("financing advantage"). In fact, a bond might be expensive relative to the theoretical curve precisely because it's too liquid and everyone's buying it ("liquidity advantage").

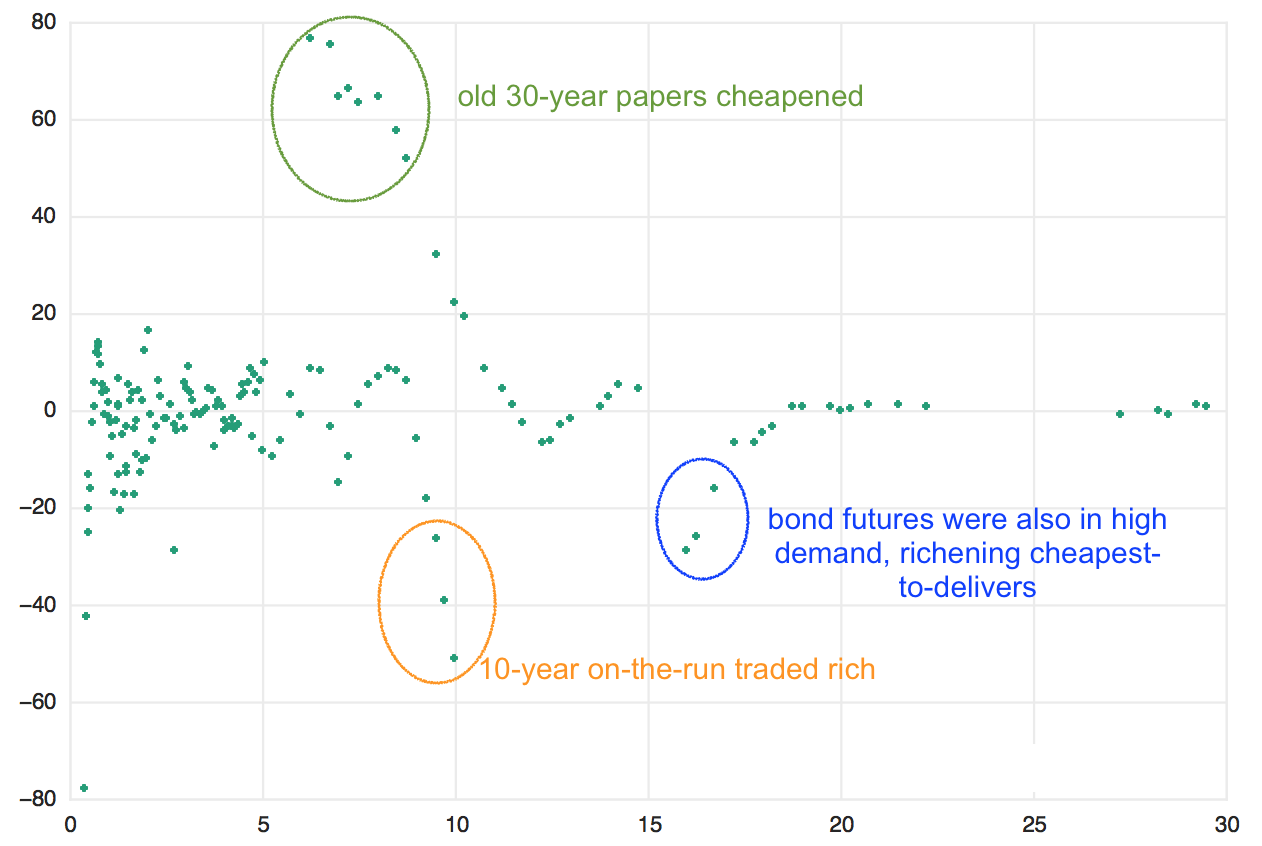
During times of stress, these spreads can become much larger. A similar chart for December 15, 2008 is shown below. Note the range on the y-axis:
enter image description here

Some bonds, such as 10-year on-the-runs and the 15-year sector, traded very rich (at extremely negative spread), because of high demand from investors looking for safe and liquid instruments. By contrast, old 30-year that have rolled into the <10-year sector traded at very cheap levels (very positive spread), because people were dumping these papers and moving into more liquid instruments or cash.

$\endgroup$
13
  • $\begingroup$ Sorry but I cannot really understand the graph, is it one graph or two separate? I cannot see the fitted curve somehow. I see only green data points. $\endgroup$ Commented May 7, 2017 at 2:25
  • $\begingroup$ It would be nice if you could provide some information of chart. I am still struggling to recognize it. What is on Y scale and X scale. Again thank you for the extensive answer. $\endgroup$ Commented May 7, 2017 at 2:32
  • $\begingroup$ I have updated both charts. Y is the spread (in basis points), X is time to maturity. $\endgroup$
    – Helin
    Commented May 7, 2017 at 2:34
  • $\begingroup$ These were original 30-year bonds that were issued 20+ years ago (at the time) and hence had <10-years to maturity. So they were very old and seasoned bonds. $\endgroup$
    – Helin
    Commented May 7, 2017 at 2:37
  • $\begingroup$ So overall, can I see it the market yield curve depends on liquid preference. If there is a perfect liquid money market account so that the investor doesn't care about the liquidity. Then the spread will be zero? $\endgroup$ Commented May 7, 2017 at 2:40
0
$\begingroup$

Illiquidity is a quantifiable state.

The debt investor is not simply picking yield. She has preferences which generate illiquidity. Some can be modelled, and these may be: coupon (above or below par rate), convexity, demand for particular date (e.g. a liability matched investment), and repo income, inter alia.

Around this, other fast money investors may smooth these interplays to normalise the spread distortions. In this mechanism they provide liquidity to the market.

A limited investible volume, amount of financing and/or balance sheet available, and risk appetite of each party determines whether the illiquidity or liquidity factors dominate.

$\endgroup$
1
  • $\begingroup$ See the Goldman 2018 discussion on adverse selection in market liquidity provision: zerohedge.com/news/2018-05-22/… $\endgroup$
    – rrg
    Commented May 25, 2018 at 18:16

Your Answer

By clicking “Post Your Answer”, you agree to our terms of service and acknowledge you have read our privacy policy.

Not the answer you're looking for? Browse other questions tagged or ask your own question.