2
$\begingroup$

I am using a python script to replicate the monthly UMD factor, disregarding small caps (ie, focusing only on the "BIG HiPRIOR" and "BIG LoPRIOR" sub-portfolios in prof. French's website).

For that purpose, I am mapping the universe of stocks to the Russell 1000, which has a good fit in terms of market cap cut-off, and downloading data from Bloomberg for the relevant constituents over the 1997-2015 period. I then follow the methodology described in prof. French's website (sort 12-2 returns, take upper and bottom 30%, etc.).

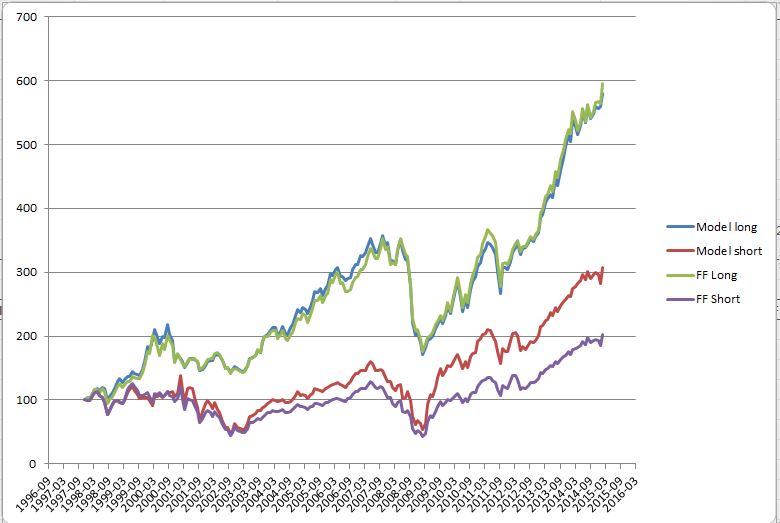
My problem is as follows: I manage to get a very close replication of the BIG HiPRIOR returns over the whole period. However, using exactly the same methodology and data, I fail to replicate the BIG LoPRIOR one:

model output

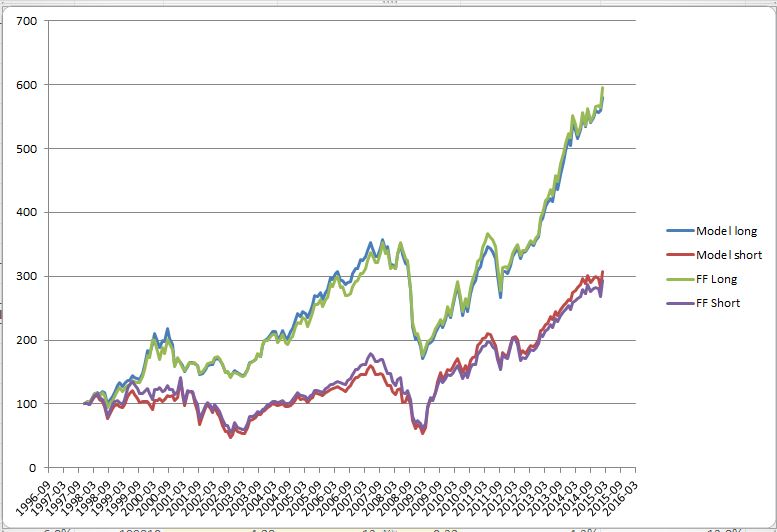
After several days of unsuccessfully trying multiple avenues to explain the discrepancy, it occurred to me that the difference in performance looked like some sort of compounding over time. So I decided to download the risk free rate from prof. French's website to see if it explained the difference. Shockingly, it did almost perfectly - if I add the risk free rate to prof. Frech's LoPrior returns only, then the match becomes just as good as for the HiPrior portfolio:

model output vs F-F with risk-free added to loPrior

Here is the issue: the risk free rate was never part of the original dataset I downloaded from Bloomberg (all I downloaded was individual stock returns for the index constituents over the relevant period). Therefore it is not possible that an error in my code would have introduced that consistent bias over time on one portfolio but not the other. The risk free data simply didn't exist as far as my model is concerned.

So at this point I am completely at a loss to explain this issue. On the one hand, I find it impossible to believe that there'd be an issue with prof. French's rigorous calculations; on the other hand I can't explain how such a precise bias (monthly risk free rate at each point in time over a period of 18 years, affecting only the LoPrior portfolio) could have crept into my model if that data simply did not exist when I ran the model.

Could I ask, to put me out of my misery, if anyone has gone through a similar exercise and successfully replicated each of the sub-portfolios used in the construction of the UMD factor?

Many thanks in advance for any help/clarity anyone could shed on this topic!

$\endgroup$
11
  • $\begingroup$ Have you considered the survivorship bias? $\endgroup$
    – Richard
    Commented Jun 9, 2017 at 11:25
  • $\begingroup$ Hi - in building my data set I took into account all stocks that ever belonged to the index, not just the ones that exist today. Plus if it was the case, surely I should see an effect both on the HiPrior and LoPrior portfolios, not just on the latter? $\endgroup$
    – Juan Q
    Commented Jun 9, 2017 at 12:49
  • $\begingroup$ So on French's website, you think that of the "6 Portfolios Formed on Size and Momentum (2 x 3)," you think the big, low prior returns portfolio may be missing the risk free rate? (Or that your code is bugged?) Did I understand your post properly? $\endgroup$ Commented Jun 9, 2017 at 20:34
  • $\begingroup$ Yes, that is exactly what I meant. $\endgroup$
    – Juan Q
    Commented Jun 9, 2017 at 22:06
  • $\begingroup$ In particular, for the "equal weighted" variety, which is where I started from as it is easier to replicate. Having said that, I am in the process of replicating the "value weight" tables and I think the issue appears as well. $\endgroup$
    – Juan Q
    Commented Jun 9, 2017 at 22:08

1 Answer 1

5
$\begingroup$

Out of curiosity, I took a quick stab at replicating the Fama-French portfolios using CRSP data.

  • I seem to be getting numbers reasonably close to Fama-French, so I think the issue is on your end.

    • It's also possible though the difference is due to using the Russell 1000 rather than the full CRSP universe. That doesn't strike me as crazy.
  • I'm for sure not matching Fama-French methodology exactly. Don't take my numbers etc... as gospel. I did this quickly.

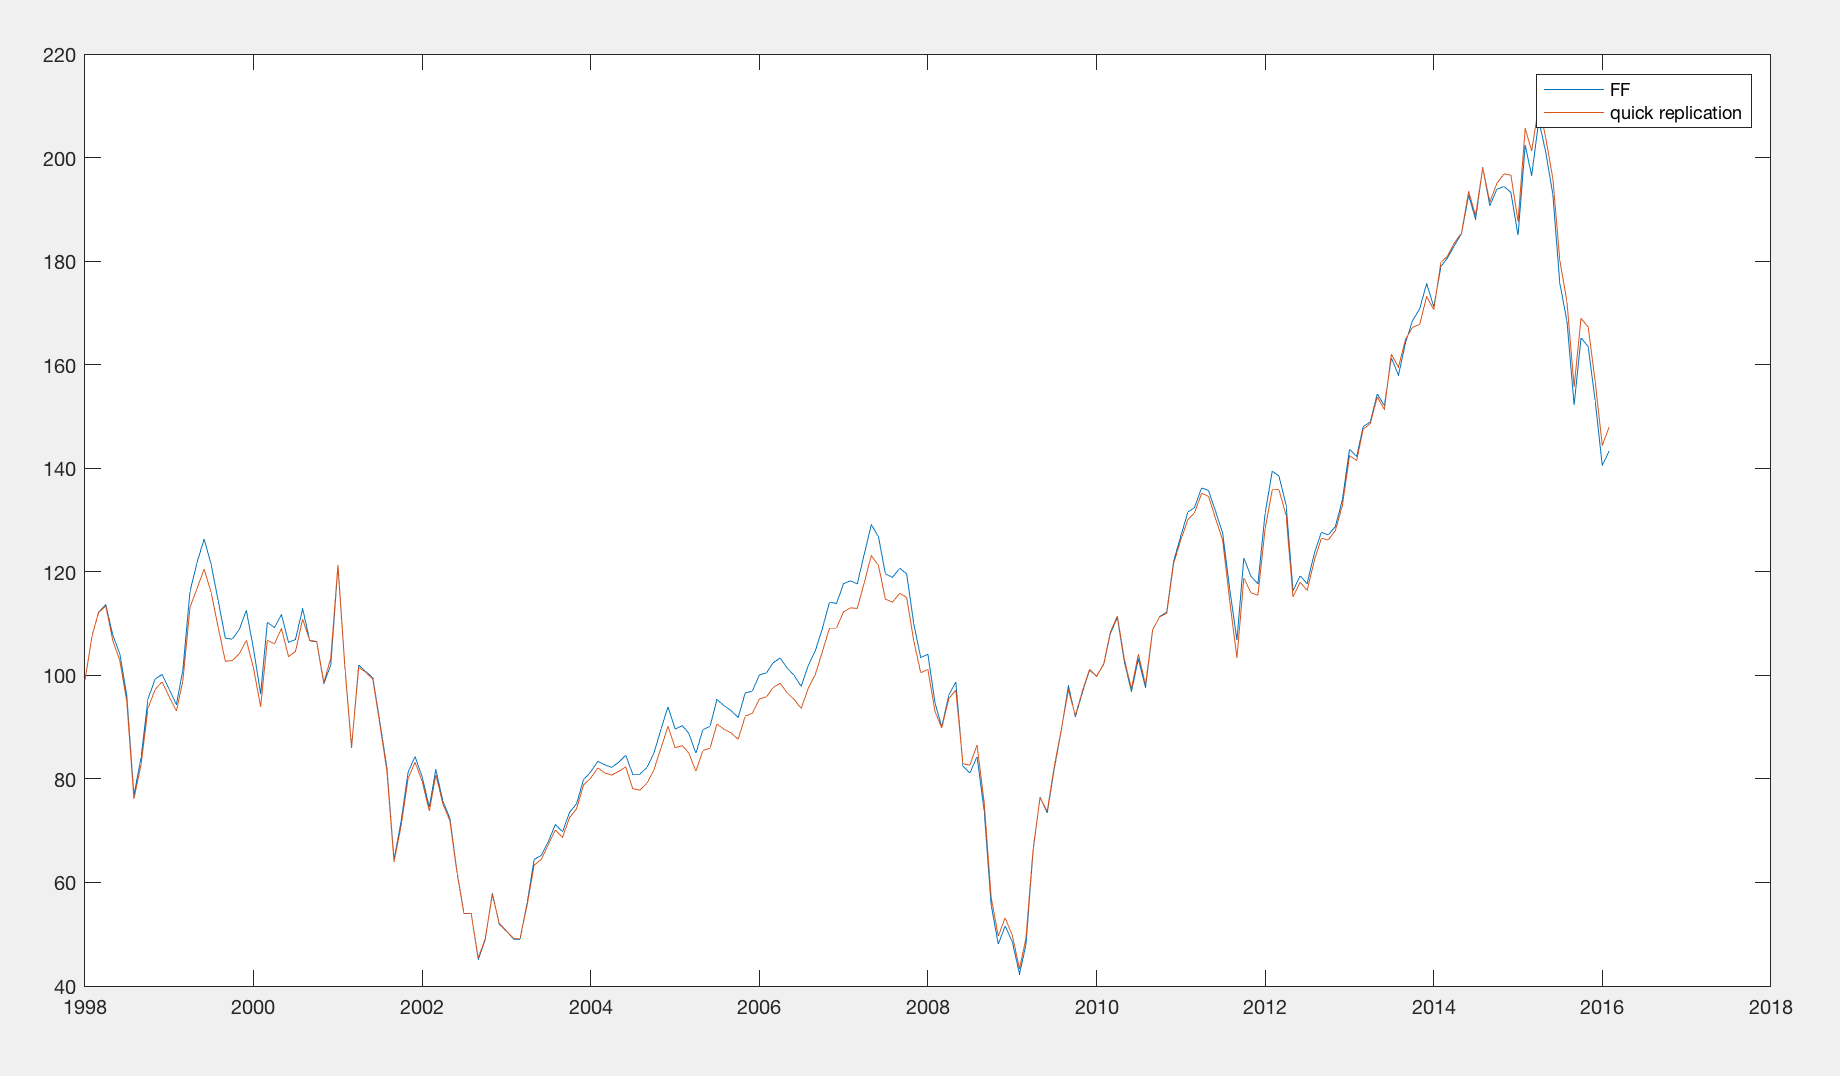
Here's my preliminary replication of the equal weight, big size, low prior return portfolio (and comparison to Fama French).

enter image description here

Some ideas:

  • I'd check your 30th percentile breakpoint vs. Ken French's computed breakpoint. (Note: I used 11 months of prior returns; I think French's computed breakpoints elsewhere on the website use 12 months?)
  • There might be an issue that you don't have companies with horrible, prior returns in the Russel 1000 because if they had horrible prior returns they would leave the index!
    • Corollary: you could be doing everything right, but you'll need the full universe to replicate Fama-French.

Some excerpts from my stuff:

These are the breakpoints for the 30th prior return percentile and the 70th prior return percentile for the 11 months of prior returns (i.e. t-12 through t-2... do they use 12?). http://www.mattgunn.com/share/quantse1/PRELIMINARY_prior_ret_breakpoints.csv

These are the returns I get for the portfolio in question: http://www.mattgunn.com/share/quantse1/PRELIMINARY_big_lowpriorret.csv

I use French's size breakpoints available here: http://mba.tuck.dartmouth.edu/pages/faculty/ken.french/data_library.html#Breakpoints

I'm using my own computed breakpoints for prior returns (in the link above), but if you're trying to match Fama-French, I'd just use their breakpoints which appear to be available at the above link.

Another obvious point that I thought I'd mention is that to compute value weight returns, you want to use the 1 month lagged market cap (eg. February return gets the weight of the end of January market cap).

$\endgroup$
2
  • $\begingroup$ That's super useful, thank you. I'm truly grateful for your help on this topic. I'll go through the breakpoints and see if that may be where the issue lies. $\endgroup$
    – Juan Q
    Commented Jun 10, 2017 at 0:45
  • $\begingroup$ @JuanQ Fama and French are quite precise and careful. In the general academic world though, it's not terribly surprising or shocking to find errors or some imprecision in published research. $\endgroup$ Commented Jun 11, 2017 at 6:15

Your Answer

By clicking “Post Your Answer”, you agree to our terms of service and acknowledge you have read our privacy policy.

Not the answer you're looking for? Browse other questions tagged or ask your own question.