I am working on a research project that requires me to run a CAPM regression on all intra-day stock quotes in NSDAQ, NYSE and all other U.S. exchanges since 1993.
The precision of the quote data is at second-level. We calculated the second by second stock returns, market returns, risk free rate, and ran a CAPM regression on the data. We used SPY return as the market benchmark.
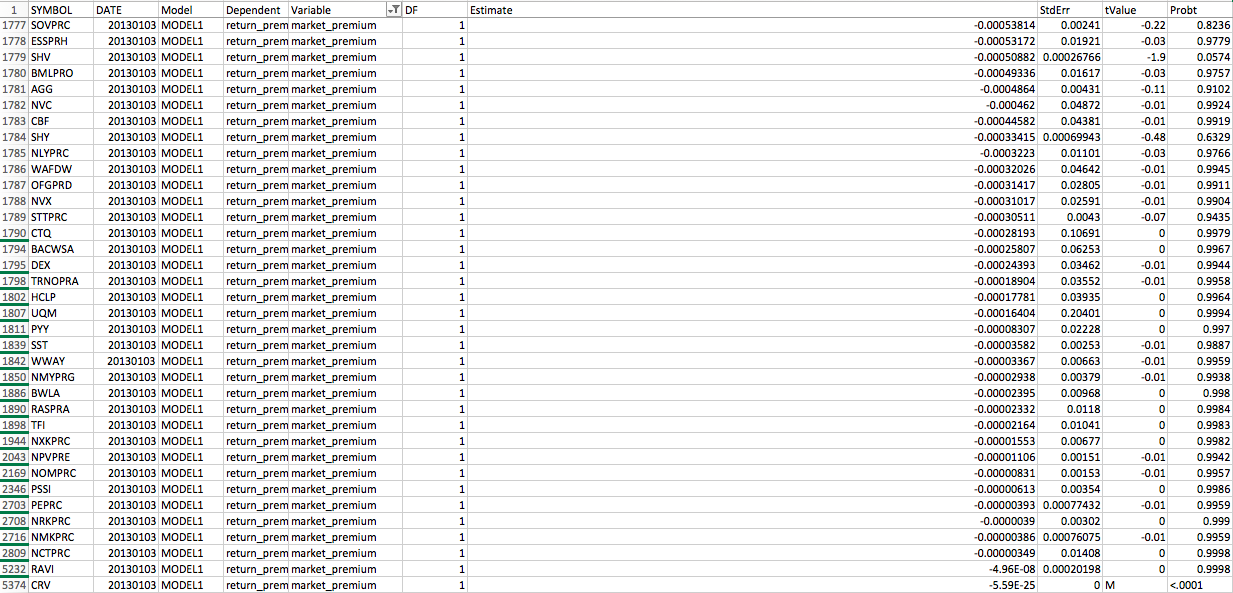
However, an interesting problem that occurred was - there are some stocks with really small beta (very close to 0). That is, the stock barely moves with the market.
While pondering about the reasons behind this, we think it might be caused by different minimum stock movements. Some stocks might be trading at \$1, but a market movement of, say, \$10, will overshoot the price movement of such stocks.
However, we are still not exactly sure about the reasons and how to adjust the data properly.
The follow screenshot is an example of how small the beta can be (estimate is the beta value).
Does anyone have an idea on this?

