0
$\begingroup$

I'm trying to build a zero/spot curve and have two pieces of information.

  • 1yr zero coupon swap = 1%
  • 3yr zero coupon swap = 3%

My initial guess was to linearly interpolate which produces a linear curve with slope 1. However, this seems very hand wavy (not rigorously justified) and I'm not convinced it is right. Is there a better approach to tackle this?

My end goal is to find overnight rates for each day in the 3yr period.

$\endgroup$

2 Answers 2

2
$\begingroup$

Consider the possible forward rates in each of the three years. I.e. In X for 1 year forward rates, where X is 0,1 or 2. Possible solutions (ignoring compounding for simplicity) include the following :

(1,3,5): Forward rates are a linear function of time. And (1,4,4): Forward rates shoot up towards 4 and then stay constant.

These are very different solutions but both are possible. Each solution can be used to produce overnight rates- for example the overnight forward rate for the first solution is 2x, where X is the forward time.

However, an intermediate solution seems more likely. Forward rates are not usually linear, nor do they reach some asymptote within a year. You don't have enough information to determine this more accurately.

$\endgroup$
0
$\begingroup$

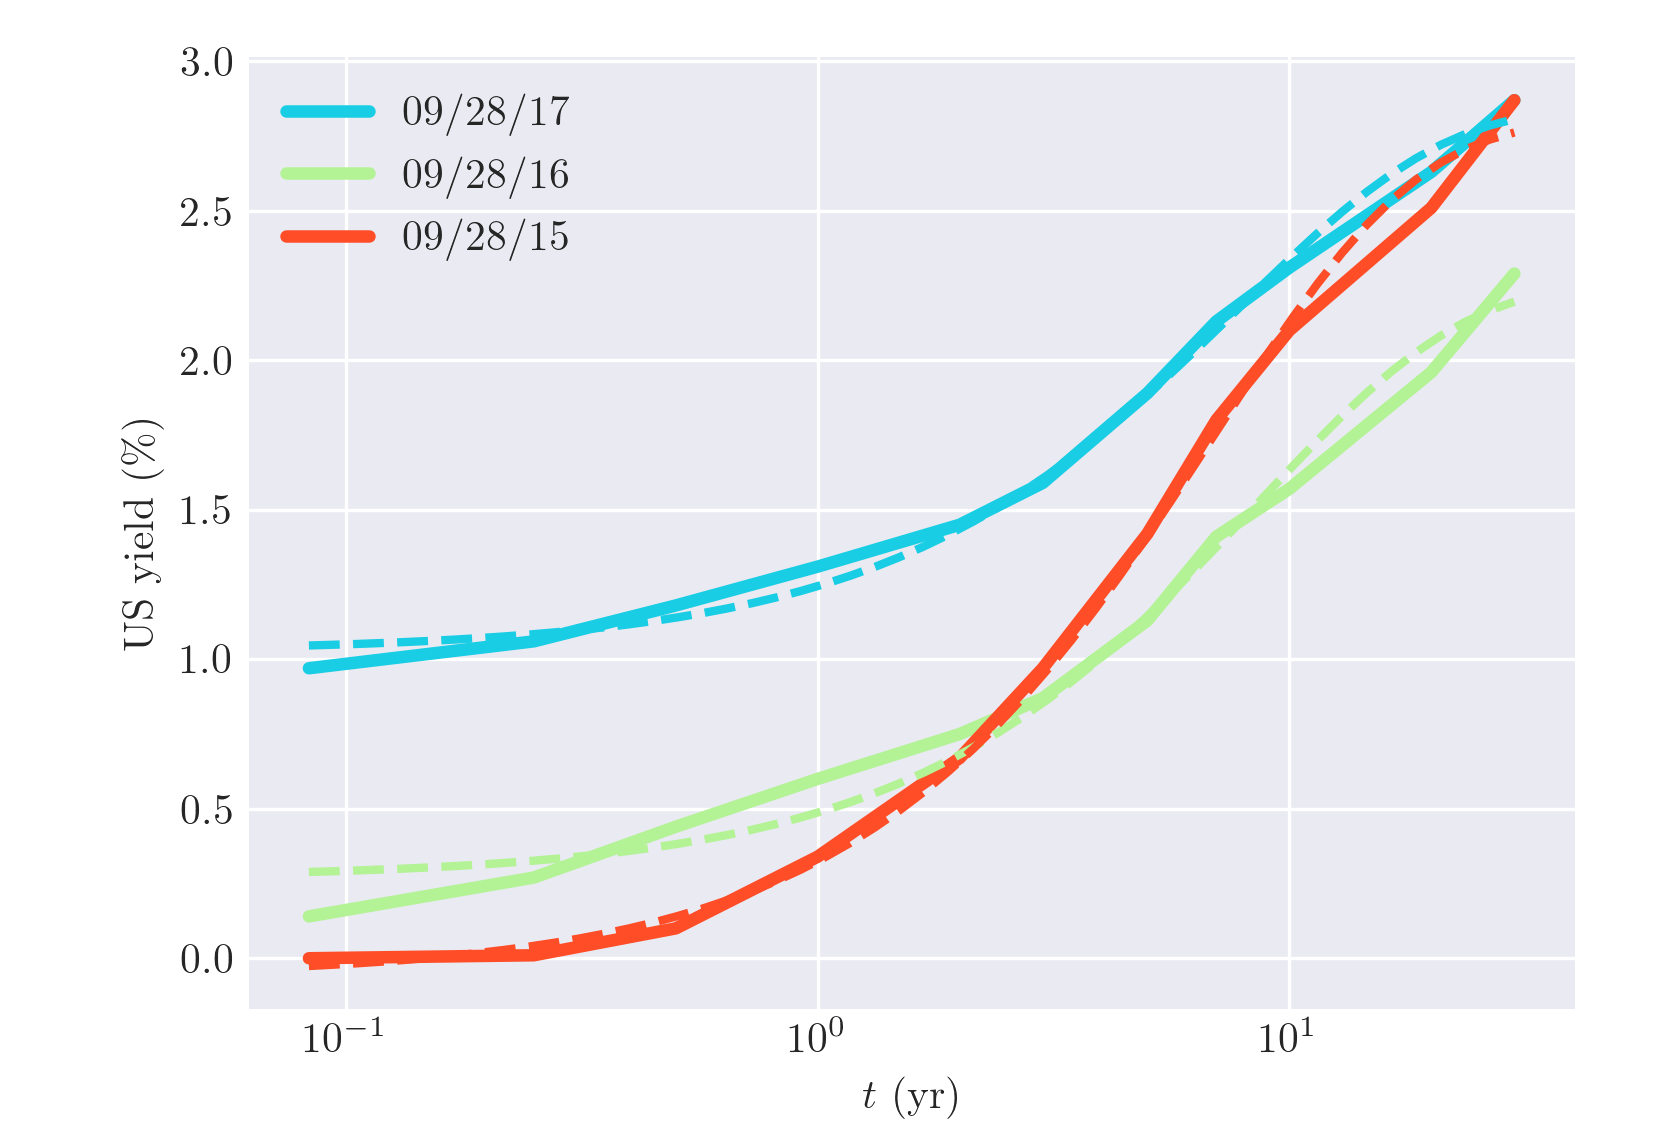
If you do not have other information about the underlying, I am afraid this is pretty much all you can do. However, it is not that bad as you think. To give you an idea below is the treasury yield rates at three different dates: today (09/28/2017), one year (09/28/2016) and two years (09/28/2016) ago

enter image description here

For each curve I fit a model (dashed lines) of the form

$$ {\rm yield} = ae^{-bt} + c $$

And these are the estimates for 09/28/2017

$$ \begin{array}{c|rrr} t~({\rm yr}) & \text{exp. fit} & \text{interp.} & \text{actual} \\ \hline 1.0 & 1.24 & 1.31 & 1.31 \\ 1.5 & 1.34 & 1.38 & - \\ 2.0 & 1.43 & 1.45 & 1.45 \\ 2.5 & 1.52 & 1.52 & - \\ 3.0 & 1.60 & 1.59 & 1.59 \\ \end{array} $$

which shows that the linear interpolation is actually really close to the exponential fit. The reason behind this is that the time variation of the yields is smooth enough to be approximated by a low order expansion around a given point in time

$\endgroup$

Your Answer

By clicking “Post Your Answer”, you agree to our terms of service and acknowledge you have read our privacy policy.

Not the answer you're looking for? Browse other questions tagged or ask your own question.