0
$\begingroup$

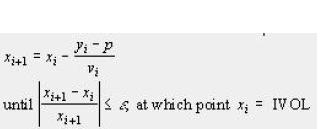
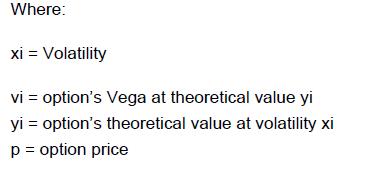
enter image description hereThink or swim has this thing where they have do a implied volatility of a stock. I have chatted with the TOS people but they aren't terribly helpful. Regardless they did send me two images of what they consider to the be formula. I'm not exactly sure if this is a good formula or something they just made up for me to go away. So I have attached the two screen shot.

Based on my poking around I would guess it's the weekly implied averages of the options one month out?

Update: I'm starting a bounty, cause I need to see a real life example from the US stock exchange, such as CMG, NFLX or whatever.

Does anybody have a clue where this formula came from, the implied volatility of stock formula? TOS formula is below, but I'm thinking it's weekly averages one month out? Thanks

enter image description here enter image description here

Update: I'm starting a bounty, cause I need to see a real life example from the US stock exchange, such as CMG, NFLX or whatever. Although I believe the answer to be correct, I need a real life example to understand it.

$\endgroup$
9
  • 5
    $\begingroup$ It's not clear what kind of real life example you want. This is simply the implied volatility calculated by root solving the Black and Scholes formula. $\endgroup$
    – Freelunch
    Commented Jan 23, 2018 at 10:40
  • 1
    $\begingroup$ See e.g. quant.stackexchange.com/questions/15198 for an implementation of the Newton method to find the implied vol. $\endgroup$ Commented Jan 23, 2018 at 10:45
  • $\begingroup$ I understand how to calculate Implied Volatility of an option. I have written that code in PHP. I clearly get that. However Think or Swim has a formula that calculates the IV of a stock. (see above) I want an example of how calculate the IV of a stock not an option. This is pretty rare formula and I can't seem to find an example. $\endgroup$
    – Chad
    Commented Jan 23, 2018 at 17:05
  • $\begingroup$ Review the Black and Scholes model, the implied volatility of an option is the implied volatility of the underlying stock. $\endgroup$
    – Freelunch
    Commented Jan 24, 2018 at 7:33
  • 4
    $\begingroup$ @Chad I really think you should try to read everyone's answers/comments again, because this question is thoroughly answered. The chart is simply showing the implied volatility of a stock, which is calculated based on options on the stock (mostly like based on a rolling tenor, perhaps rolling 1m or rolling 3m expiry options – you have to ask TOS what expiry they are using). The formula you quoted, as everyone has mentioned, is simply the numerical method for computing implied volatility of an option – the Black-Sholes formula has no closed form solution, this is how you solve it. $\endgroup$
    – Helin
    Commented Jan 27, 2018 at 8:12

2 Answers 2

11
$\begingroup$

What they gave you is Newton's formula.

If you have a function $f(x)$ then you can find the value $x_0$ such that $f(x_0) = 0$ by this method. It uses the derivative $f'$ which in your case is the vega.

Your function is: $$ f(x) = BS(x) - M $$ where $BS$ is the theoretical price with volatility $x$ and $M$ is the marketprice. Then $f'(x)$ is the derivative of the theoretical privce w.r.t. to the volatility - thus the vega. Note that

$$f(x_0) = 0 \Leftrightarrow BS(x_0) = M$$ for some volatility $x_0$.

The equation with the $\epsilon$ means that you stop if two consecutive values are close enough.

$\endgroup$
3
  • $\begingroup$ From best I can tell this looks like the answer and although I understand the BS model, my background is programming (python,php) any chance for a real life example. This looks like foreign programming language to me, that I can't decipher. $\endgroup$
    – Chad
    Commented Jan 11, 2018 at 22:12
  • 1
    $\begingroup$ This is mathematics.... The basis of lots of nice programming :) did you go through the Wikipedia article? Or Google the method? Try it in Excel? $\endgroup$
    – Richi Wa
    Commented Jan 12, 2018 at 5:39
  • 4
    $\begingroup$ Look at $f(x) = x^2-5$ which has the root at $\sqrt{5}$. Then start at $x = 10%$ and iteratively you approach the root following the formula that they provided ... Newton's formula. $\endgroup$
    – Richi Wa
    Commented Jan 12, 2018 at 8:12
4
$\begingroup$

Richard's answer is the correct answer to a slightly different question. I think what you’re asking for is the weighted average option implied volatility for a stock.

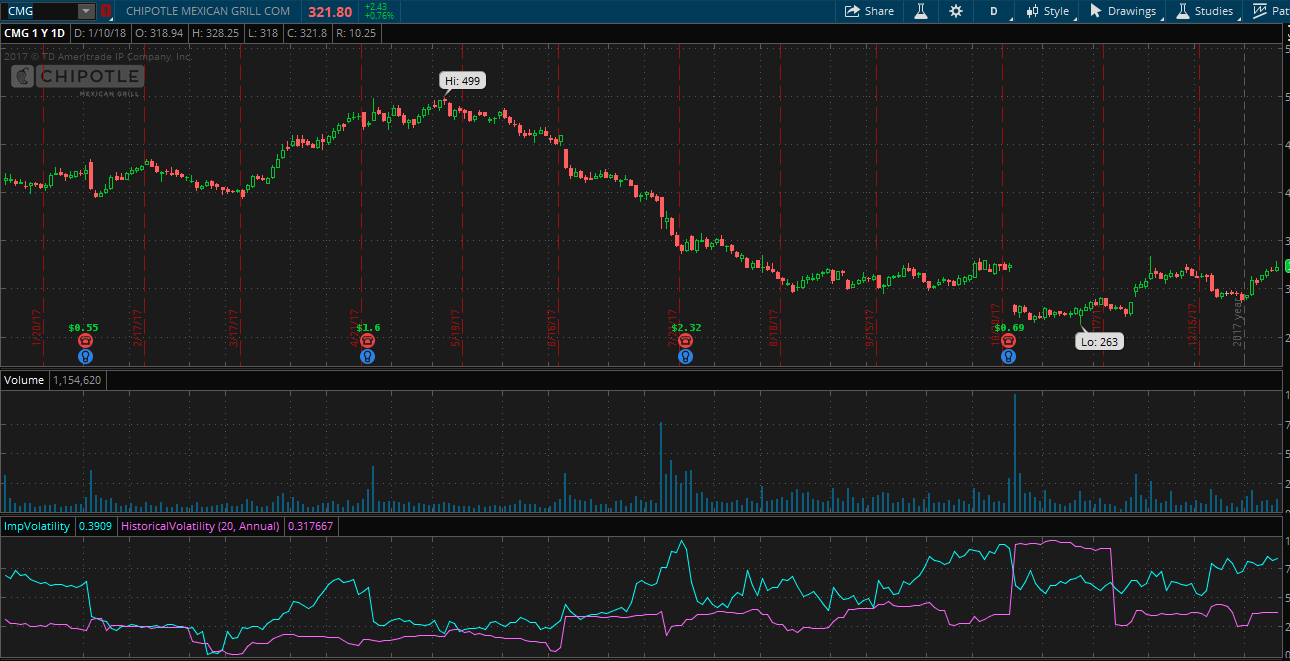
The implied volatility of a stock is analogous to the CBOE’s VIX Index for the S&P 500 Index (other securities have IV indices as well). The VIX uses a known methodology for imputing the implied volatility of a weighted strip of options in order to interpolate the one-month implied volatility of the index. A detailed description of the VIX' calculation is available on the CBOE website. Also, see the previous post for a detailed explanation on the evolution of the VIX.

The first step is always to determine the implied volatilities a cross-section of option contracts. Richard provides one such method. I do not want to detract from it.

The next task is to aggregate the individual option contracts in a meaningful way. There are likely significant differences in how the “sausage is made” amongst various brokers and data-providers.

I assume that most use methods and heuristics to come up with something analogous to the VIX. On the simplest level, the implied volatility index for any given stock is an open-interest-weighted and maturity-weighted weighted average of the individual options’ implied volatilities.

I cannot speak to ThinkOrSwim’s exact approach, but I would be willing to bet it mirrors CBOE’s pre-2014 approach. Also, I do recall that TradeSation’s stock implied volatility algorithm is available in its native programming language—EasyLanguage. From what I recall, TradeStation calculates a stock’s implied volatility as a weighted average of out of the money puts and calls going forward on both the first and second expiration months.

On a side note, just you can't actually trade an index, you cannot trade IV directly, but rather have to take a position in a tracking instrument or create a synthetic position.


Also, I am copying code from VBA which uses the Newton's algorithm to find the implied volatility of a call option given the underlying price, exercise price, time, interest, target (usually market) price of a call, and dividend yield.

  1. $d_1$
Function dOne(UnderlyingPrice, ExercisePrice, Time, Interest, Volatility, Dividend)
dOne = (Log(UnderlyingPrice / ExercisePrice) + (Interest - Dividend + 0.5 * Volatility ^ 2) * Time) / (Volatility * (Sqr(Time)))
End Function
  1. Value of call options
Function CallOption(UnderlyingPrice, ExercisePrice, Time, Interest, Volatility, Dividend)
CallOption = Exp(-Dividend * Time) * UnderlyingPrice * Application.NormSDist(dOne(UnderlyingPrice, ExercisePrice, Time, Interest, Volatility, Dividend)) - ExercisePrice * Exp(-Interest * Time) * Application.NormSDist(dOne(UnderlyingPrice, ExercisePrice, Time, Interest, Volatility, Dividend) - Volatility * Sqr(Time))
End Function 
  1. Implied call volatility
Function ImpliedCallVolatility(UnderlyingPrice, ExercisePrice, Time, Interest, Target, Dividend)
High = 5
Low = 0
Do While (High - Low) > 0.0001
If CallOption(UnderlyingPrice, ExercisePrice, Time, Interest, (High + Low) / 2, Dividend) > Target Then
High = (High + Low) / 2
Else: Low = (High + Low) / 2
End If
Loop
ImpliedCallVolatility = (High + Low) / 2
End Function
$\endgroup$
1
  • $\begingroup$ A newbie question -- how does the formula need to be changed in order to calculate the volatility of a put? Thank you! $\endgroup$ Commented Apr 21, 2021 at 2:34

Your Answer

By clicking “Post Your Answer”, you agree to our terms of service and acknowledge you have read our privacy policy.

Not the answer you're looking for? Browse other questions tagged or ask your own question.