21
$\begingroup$

I am looking to convince someone that an annualized Sharpe Ratio of 7 is 'extremely high' for a low frequency (daily rebalancing, say) long-short technical strategy on U.S. equities. I was hoping for a published source (preferably a journal article or conference paper) that either

  1. Provides a scale for interpreting Sharpe (e.g. "> 1 is good, > 2 is excellent, ... "), based on observed Sharpe ratios of, say, active managers, or some such. (I can imagine this being rejected as "biased" or "underinformed")
  2. Preferrably, presents statistics on achieved Sharpe ratios of Hedge Funds and other active managers, perhaps by strategy class, with long-ish histories, even with some back-fill bias, that would allow one to estimate what quantile a given Sharpe ratio would fall at. (e.g. "the cutoff for top 1% of Convertible Arb. funds achieved Sharpe is 1.5" (I am making that up.))

edit: I reiterate that I have no doubts the number is bogus, but am trying to convince someone else, someone without much market experience, that this is way outside of normal.

$\endgroup$
8
  • $\begingroup$ 7 is too high to be true for a low frequency strategy. I do not believe it and nor should your investors. Is this off the back of back tests or is this your risk adjusted performance of real trades, trades you put on in a fully funded (not simulated) trading account? $\endgroup$
    – Matt Wolf
    Commented Aug 1, 2012 at 5:22
  • $\begingroup$ @Freddy I don't believe it either, and find it absurd. The number is from a backtest performed by a third party. My job is to convince someone that this figure is suspiciously high. If I just tell them I think it is too high, it is my word against someone else's. This is why I am looking for a published account that, presumably, has been vetted and is representative of achieved performance. $\endgroup$
    – shabbychef
    Commented Aug 1, 2012 at 5:38
  • 1
    $\begingroup$ The tag "harpe-ratio" misses an "s" ... I don't have the privilege to edit the tag. $\endgroup$
    – Richi Wa
    Commented Aug 1, 2012 at 6:34
  • 6
    $\begingroup$ I remember one of my mentors years ago was trying to explain to a junior colleague why a high Sharpe ratio in a particular low-frequency backtest he had run was unbelievable. He said, "if this were true, we'd put all of our money into this strategy." Then he pointed to the converts desk and said, "And we'd put all of their money into this strategy." Also worth noting: Peter Muller, who used to run PDT at Morgan Stanley, has said that a realized Sharpe ratio of 2 should be considered amazing. $\endgroup$ Commented Aug 1, 2012 at 11:21
  • 1
    $\begingroup$ is it 7 without transaction costs? $\endgroup$
    – pyCthon
    Commented Aug 1, 2012 at 15:56

6 Answers 6

12
$\begingroup$

Here are couple references. Especially the first link to Andy Lo's paper contains a list of Sharpe ratios of popular mutual and hedge funds:

The Statistics of Sharpe Ratios

Dow Jones Credit Suisse Hedge Fund Index

Generalized Sharpe Ratios and Portfolio Performance Evaluation

I would go with the first paper.

$\endgroup$
2
  • $\begingroup$ None of these three links are currently working. Can you update or provide some summary statistics? $\endgroup$
    – Jared
    Commented Aug 28, 2018 at 19:00
  • $\begingroup$ @Jared, updated, though a google search would have immediately brought up the results, too. $\endgroup$
    – Matt Wolf
    Commented Aug 29, 2018 at 7:05
11
$\begingroup$

The answer your are looking for might be the story in "Benchmarking Measures of Investment Performance with Perfect-Foresight and Bankrupt Asset Allocation Strategies", by Grauer (Journal of Portfolio Management).

While this work main concerns are the differential ranking of various performance measures and with negative betas for market timing strategies, its analysis of perfect foresight allocation is relevant to the point you want to make.

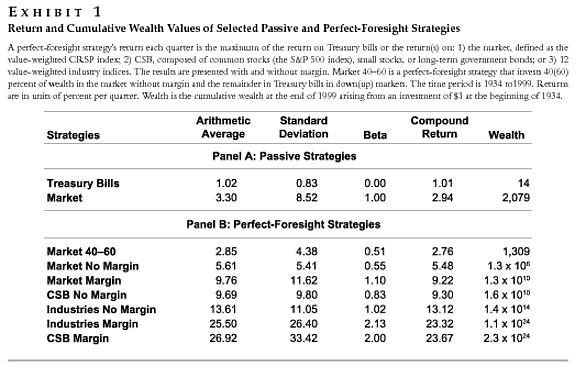
The punch line is that even perfect foresight strategies that grow an investment more than trillion-fold over ~60 years have a sharpe ratio that is barely in excess of 1.

The table below describes summarily the low frequency strategies considered (I believe monthly, but it might be quarterly) and reports the wealth accumulated from 1934 to 1999 assuming an initial investment of 1 dollar.

enter image description here

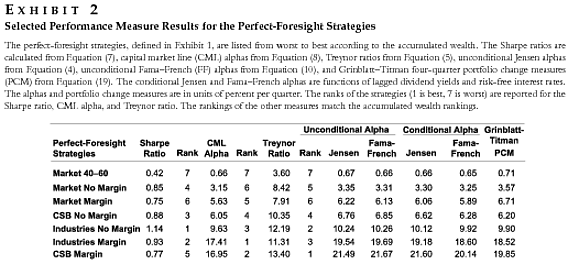
Some selected performance measures for this strategies are in the next table:

enter image description here

The "Industry No Margin" perfect foresight strategy multiplies the initial investment by a factor of $\mathbf{1.4x10^{14}}$ over 65 years, yet it achieves a Sharp ratio of 1.14.

These observations don't settle the question, but they should instill enough doubts about any claim of a 7+ sharpe ratio for a low frequency strategies.

$\endgroup$
1
  • 1
    $\begingroup$ This is one thing that burns my butter: Sharpe ratios published without units! I cannot tell from Exhibit 2 shown above whether the SRs are monthly, quarterly, or annualized. It matters! (Although in this case, not terribly). $\endgroup$
    – shabbychef
    Commented Jun 1, 2013 at 0:31
5
$\begingroup$

I would even stick to the original paper by Sharpe (1966):

Mutual Fund Performance. The Journal of Business Vol. 39, No. 1, Part 2 pp.119--138

If you look at the numbers on Page 6 you can see that the funds sharpe ratios roughly are between $0$ and $1$.

Since the Sharpe ratio already adjusts for the risk-free rate, you cannot really argue about its change. And if you do, you have to take into account that markets have become more efficient since 1966 (computers) so one would suspect the Sharpe ratio to have a tendency to be lower.

If you know facts about the calculation methodology of the backtest (which timeseries are involved) you could also look for signs of bias (look-ahead?) or to re-calculate the strategy for yourself.

$\endgroup$
8
  • $\begingroup$ Totally agree to your answer. Everything above 1 is questionable - especially in a back test. $\endgroup$
    – Richi Wa
    Commented Aug 1, 2012 at 6:35
  • $\begingroup$ @Richard, this is not what Vanguard said, and you are quite incorrect, generally Sharpe ratios in back tests are better than Sharpe ratios measured on real returns. $\endgroup$
    – Matt Wolf
    Commented Aug 1, 2012 at 7:20
  • $\begingroup$ @Richard, I quite disagree with your post, in fact empirical evidence points to the fact that you are incorrect in your assertion. Sharpe ratios have gone up over time because hedge funds and mutual funds alike have moved to new asset classes which added diversification effects and thus improved risk adjusted returns over time. Also short selling and hedging skills have improved over time, adding value as well. If anything then Sharpe ratios have somewhat increased over time (please take a look at my referenced papers in my own answer). $\endgroup$
    – Matt Wolf
    Commented Aug 1, 2012 at 7:24
  • $\begingroup$ @Freddy, I will have a look at your references. Maybe my post was unclear. What I want to say: I often see high Sharpe ratios in back tests but the Sharpe ratio when a strategy goes live is most of the time much lower. Some back tests are misleading. E.g. it depends on the assumption of which prices to take. I saw back tests on option stategies where prices between entry and maturity were interpolated. This can reduce volatility estimates. As a summary: when somebody shows me a Sharpe ratio $> 1$ on a back test then I usually have a lof of questions. That's why I agree to vanguard2k. $\endgroup$
    – Richi Wa
    Commented Aug 1, 2012 at 8:24
  • 1
    $\begingroup$ ...however it will be very seldom that such strategies employ a significant enough notional portion to significantly kick up the whole fund's ratio. I think one should keep in mind the distinction between Sharpe ratios of individual strategies vs the one of whole fund companies. Also a distinction must be made between Sharpe ratios of single strategies that employ different amounts of notional. $\endgroup$
    – Matt Wolf
    Commented Aug 1, 2012 at 15:14
4
$\begingroup$

Pardon the lack of an actual link, and the formatting, but in footnote 6 of "Alpha is Volatility times IC times Score", Grinold, Richard C.,
Journal of Portfolio Management, Summer 1994 v20 n4 p9(8)
, Grinold suggests that "a truly outstanding manager" might have an information ratio of 1.33:

(6) A rough guideline for determining the required IC comes from Grinold !1989^. If you have N stocks, then a truly outstanding manager who has an information ratio of IR = 1.33 (corresponding to a t-stat of 3 over five years) will need an IC (for each stock!) given approximately by IC = {IR}/!(# of Stocks).sup.1/2^ = 1.33/!(500).sup.1/2^ = 0.06. Top quartile might have (let's be generous) an information ratio of IR = 0.90 (t-stat of 2 over five years); thus the IC of 0.04 = 0.9/!(500).sup.1/2^. These numbers are rough guidelines. The guideline can tell us that for 500 stocks and a quality manager ICs of 0.3 or 0.001 are out of range. The rough guideline will not help us tell if 0.03 or 0.04 is a better choice.

$\endgroup$
4
$\begingroup$

Perhaps check out Poti and Levich (2009), or in a different setting but from one of the same authors, Poti and Wang (2010) "The coskewness puzzle" in JBF. They directly address the issue of what level of SR is plausible.

$\endgroup$
2
$\begingroup$

This is a very common and serious problem among academic papers and with some hedge fund marketing materials, I can almost guarantee that the high ratio of 7 was without transaction costs and that when these are included this 7 will drop down somewhere between 0 and 1.

$\endgroup$
9
  • 1
    $\begingroup$ Any backing to your claims? $\endgroup$
    – Ryogi
    Commented Aug 1, 2012 at 18:28
  • $\begingroup$ do this as a simple exercise, calculate the sharpe ratio for a simple strategy, with and with out the risk-free , and with and without transaction costs see what happens $\endgroup$
    – pyCthon
    Commented Aug 1, 2012 at 18:43
  • 4
    $\begingroup$ I was referring to this claim: " ... very common and serious problem among academic papers". $\endgroup$
    – Ryogi
    Commented Aug 1, 2012 at 18:51
  • 2
    $\begingroup$ I'd like factual statements to be substantiated with evidence. In my experience, top finance journals routinely require transaction cost analysis as a robustness check to any finding. $\endgroup$
    – Ryogi
    Commented Aug 9, 2012 at 0:24
  • 2
    $\begingroup$ well maybe your experience has been different from mine $\endgroup$
    – pyCthon
    Commented Aug 9, 2012 at 13:43

Your Answer

By clicking “Post Your Answer”, you agree to our terms of service and acknowledge you have read our privacy policy.

Not the answer you're looking for? Browse other questions tagged or ask your own question.