2
$\begingroup$

Is there a standardized way of transforming the ratings of any of the major ratings agencies (S&P, Moody's, Fitch) to a numerical value. Ideally, it might be possible to create a similar scale for all of them. I just found some academic papers, which just assigned numerical values, i.e. 1 for AAA and 22 for D. Just interested if there are conventions on how to convert the ratings. Additionally, it would help comparing the impact of ratings in empirical studies.

I found some documents by ESMA, which are outlining their mappings approach. Mapping by ESMA
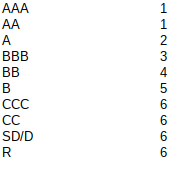
"Mapping of Standard & Poor’s Ratings Services’credit assessments under the Standardised Approach" - Link to Report In their approach the mapping is the following:

$\endgroup$

2 Answers 2

3
$\begingroup$

Mapping ordinal data to interval data is arbitrarily.


The ranking of rating agencies is ordinal data, so only comparing operators > or < can be applied. The data can be sorted and as a central tendency, you can calculate the median.

The main aspect of ordinal data is that it allows for rank order but it does not allow for the relative degree of difference between them. E.g. the difference between the rankings AAA and AA may not equal the difference between BBB and BB. Your figure shows this explicitly by assigning different rankings the same (arbitrary) numerical value.

Comparing the impact of ratings is still possible however, by applying ordinal regression instead of a linear regression, if the dependent variable is in ordinal data. Commonly used models for this are ordered logit or ordered probit models. If the independent variable is in ordinal data, you may use dummy variables to control for their impact in a regression.

$\endgroup$
6
  • $\begingroup$ Thanks, yeah of course I didn't want to transform it into a cardinal measure. But I think if I use them as a dummy with multiple values, it's basically the same as the mapping of ESMA. Additionally, I would then be able to state that a higher rating increases or decreases the dependent variable. Of course the magnitude can't be interpreted, but the sign could be interpreted. $\endgroup$
    – hannes101
    Commented Feb 15, 2019 at 12:13
  • $\begingroup$ I think you are not right when you state that a dummy variable is basically the same as the ESMA mapping. If you apply $n-1$ dummies for you $n$ (here: $n=10$) rating variables and define AAA is the baseline, you can interpret the dummy-coefficient as the effect with regards to the baseline variable (e.g. AAA); i.e. you get exactly the proportion of a stock return which is due to it being rated e.g. BBB instead of the baseline AAA. $\endgroup$ Commented Feb 18, 2019 at 15:24
  • $\begingroup$ I don't mean a binary dummy, but rather an ordinal one. Of course the interpretation for dummies changes, if you change the baseline, i.e. also estimation with or without constant or which dummy is left out. $\endgroup$
    – hannes101
    Commented Feb 19, 2019 at 9:02
  • $\begingroup$ I highly recommend you to look at this answer, why one should prefer binary dummy variables instead of other scaling methods. $\endgroup$ Commented Feb 26, 2019 at 14:55
  • 1
    $\begingroup$ It does and is a common approach (especially in broad international studies with country dummies for each country): Define the baseline to be rating AAA. Add nine (binary) dummy variables, each one for a rating AA down to R. If e.g. a company is rated BBB, set its corresponding dummy to one and all remaining dummies to zero. The interpretation of the coefficients of all nine dummy variables is simple: It is just the effect (on the stock return as dependent variable) of a company being rated in a certain category corresponding to be rated in AAA (or your predefined baseline). $\endgroup$ Commented Feb 27, 2019 at 8:11
1
$\begingroup$

One possible approach to mapping these ordinal measures into cardinal measures is to use something like average default probabilities of each of the ratings over the period in question. One can perhaps enhance the mapping by using transition probabilities of each rating into the other ratings over the period to take into account the distribution of ratings for each entity.

$\endgroup$
3
  • $\begingroup$ A mapping could be: credit rating to distance to default, in a similar way as the KMV model, which maps distance to default to expected default frequency. $\endgroup$ Commented Feb 17, 2019 at 3:10
  • 1
    $\begingroup$ This answer seems to be pointing in the right direction. I'm not sure why one would want to find some arbitrary order-preserving mapping of ratings into numbers (e.g., equally spaced integers) when the agency themselves associate meaningful default frequencies that generally have the some order (see published ratings transition matrices). The default frequencies are generally montonically increasing as the ratings decline. Where this is not the case, it usually points to small sample issues and could be adjusted in some ad hoc fashion. $\endgroup$
    – RRL
    Commented Feb 18, 2019 at 21:56
  • $\begingroup$ @RRL actually, I would say this is what I mean. If there's a meaningful way to describe the order of the ratings and keep their cardinal nature, this is the best way to go. But the issue with these is that they are often calculated with a certain time horizon and it's pretty difficult to find them for the time horizon in question. $\endgroup$
    – hannes101
    Commented Feb 26, 2019 at 13:04

Your Answer

By clicking “Post Your Answer”, you agree to our terms of service and acknowledge you have read our privacy policy.

Not the answer you're looking for? Browse other questions tagged or ask your own question.