6
$\begingroup$

I was doing an exercise on investigating the relationship between European Call option price and its volatility. I was asked to compute $\frac{\partial^2C}{\partial \sigma^2}$ and find out the domain of $\sigma$ on which the option price $C$ is convex.

I got the second order derivative as shown: $$ \frac{\partial^2C}{\partial \sigma^2} = Vega \cdot \frac{d_1d_2}{\sigma}, $$ where $d_1, d_2$ are the parameters in Black Scholes formula. To find the required domain, I let the second order derivative to be non-negative, and I argue that $Vega$ is always non-negative, so I need $d_1$ and $d_2$ with same sign.

I am not sure if my approach is correct or not, since I got a quite wierd range for $\sigma$: $$ \sigma \le \sqrt{\frac{2(\log S_t/K + r(T-t))}{T-t}}, $$ or $$ \sigma \le \sqrt{\frac{2(-\log S_t/K - r(T-t))}{T-t}}. $$

$\endgroup$
7
  • $\begingroup$ Isn't call option price always convex? If we just plot the option price on the y-axis and the spot price on the x-axis, you will get a convex shape: this shape should be valid for all maturities, all values of the risk-free rate and all IVs. If I am wrong, I look forward to being corrected. $\endgroup$ Commented Oct 18, 2020 at 9:29
  • $\begingroup$ I think op means with respect to implied vol $\endgroup$
    – StackG
    Commented Oct 18, 2020 at 9:38
  • $\begingroup$ @JanStuller What I mean is the graph of call option price with respect to volatility. $\endgroup$
    – Van Tom
    Commented Oct 18, 2020 at 9:55
  • 1
    $\begingroup$ Interesting question, and great answers below! $\endgroup$
    – StackG
    Commented Oct 19, 2020 at 1:19
  • 1
    $\begingroup$ I certainly expect that increasing vol will cause prices to increase, don't you? And I think this is capturing the effect of ITM vs OTM on that relationship? Not sure what doesn't qualify as 'real world' here? $\endgroup$
    – StackG
    Commented Oct 19, 2020 at 12:18

2 Answers 2

14
$\begingroup$

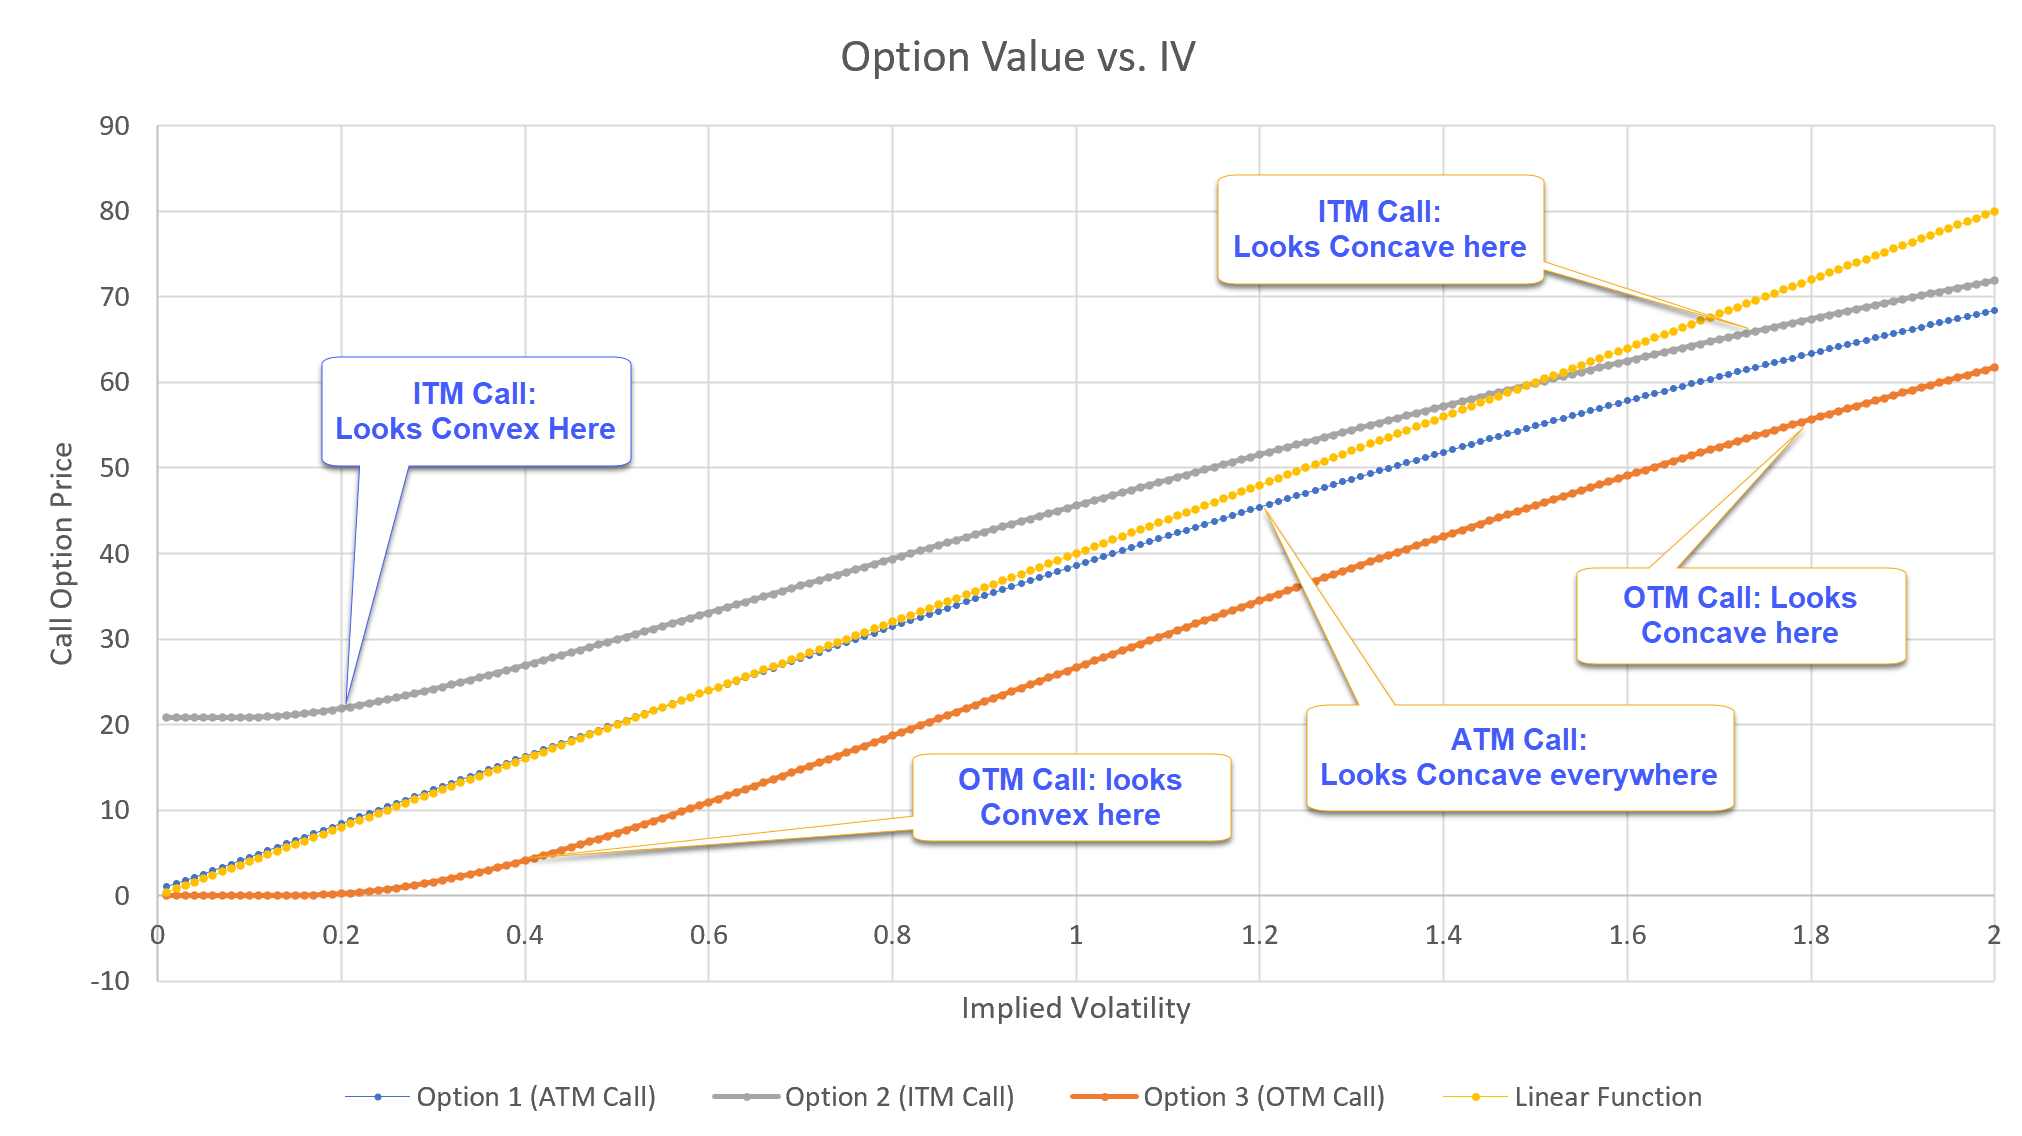
I think it's interesting to look at this problem graphically also. I get a different answer, depending on whether the option is ITM, ATM, or OTM. In the plot below, all options have 1-year expiry, rates are set to 0.01 and spot is 100. The ITM call has strike 80, the ATM call has strike 100 and the OTM call has strike 150. I added a linear function (y = 40* vol) for comparison in yellow colour. This is what I get:

enter image description here

For completeness, we can show that the ATM options are concave for all values of IV, as the chart above alludes to (to this end, we wanna show that $\frac{\partial^2}{\partial \sigma^2}\left(Option Price\right)\leq0$: since $\frac{\partial}{\partial \sigma}\left(Option Price\right)$ is the Vega, we can just differentiate the Vega):

For both Calls & Puts: $ Vega(t)=S_t N'(d1)\sqrt{\tau} $

For ATM options: $d1=0.5\sigma \sqrt{\tau}$

NTS: $\frac{\partial}{\partial \sigma} Vega(t) \leq 0 \forall \sigma$:

$$ \frac{\partial}{\partial \sigma} \left( S_t N'(d1)\sqrt{\tau} \right) = S_t \sqrt{\tau} \frac{\partial}{\partial \sigma} \left(\frac{1}{\sqrt{2\pi}}e^{0.5(-d1^2)} \right) =\\= S_t \sqrt{\tau} \frac{\partial}{\partial d1} \left(\frac{1}{\sqrt{2\pi}}e^{0.5(-d1^2)} \right) \frac{\partial d1}{\partial \sigma}=\\= S_t \sqrt{\tau} (-d1)\left(\frac{1}{\sqrt{2\pi}}e^{0.5(-d1^2)} \right)0.5\sqrt{\tau}=\\=-0.25S_t\sigma\tau^{\frac{3}{2}} N'(0.5\sigma \sqrt{\tau}) $$

Because of the $-0.25$ coefficient above, the function is negative $\forall$ positive $\sigma$, which proves the required result, for both Calls & Puts.

$\endgroup$
3
  • 1
    $\begingroup$ Interesting. Maybe someome could prove analytically that for ATM it is concave everywhere. $\endgroup$
    – nbbo2
    Commented Oct 18, 2020 at 17:14
  • $\begingroup$ ATM, i.e. at F=X, d1*d2<0 for all IV and T>0, no? $\endgroup$ Commented Oct 18, 2020 at 18:34
  • 1
    $\begingroup$ Agreed d1d2= $-\ sigma^2 T/4$ $\endgroup$
    – dm63
    Commented Oct 18, 2020 at 18:46
5
$\begingroup$

To add to @Jan Stuller answer , ATM options are pretty close to linear in volatility in the BS model (and exactly linear in the normalized Bachelier model). Options away from the strike are positively convex in volatility (note that OTM vs ITM makes no difference , just distance from strike). The exception is that in BS at very high lognormal vols, there is some negative convexity due to the fact that call prices are bounded in the upside by the stock price. In normal models OTM options are strictly positive convexity in implied vol.

$\endgroup$
1
  • $\begingroup$ Yes, the ATM call looks pretty linear all the way to IV = 100%. But judging by how it slightly crosses the linear yellow line in this range, it might be ever so slightly concave nonetheless. $\endgroup$ Commented Oct 18, 2020 at 17:25

Your Answer

By clicking “Post Your Answer”, you agree to our terms of service and acknowledge you have read our privacy policy.

Not the answer you're looking for? Browse other questions tagged or ask your own question.