2
$\begingroup$

Frequently we hear that implied volatility being higher (as measured by VIX) indicates fear in the stock market. It is assumed that investors buy more puts for downside protection, driving put option prices and thus implied volatilities up.

Similarly, in stocks with extreme greed and bullishness, such as Gamestop, you also see the price of call options being driven up.

Given this, it seems like implied volatility is a measure of both fear and greed, and not only fear. But by put-call parity, for at the money options, and near zero interest rates, the price of the put must follow the price of the call and/or vice versa.

If both greed and fear are responsible for higher VIX, then is it incorrect to understand VIX as a fear gauge? How should we understand the directionality of what's driving the implied volatility?

$\endgroup$
2
  • 1
    $\begingroup$ We did some work on a related question here sciencedirect.com/science/article/abs/pii/S0378426620301412 and found that the premium for index options comes from downside risk (significantly) and not so much from upside ‚risk‘. $\endgroup$ Commented May 4, 2021 at 18:47
  • $\begingroup$ In the stk market there is a negative correlation between price changes and implied vol changes (sometimes called "the leverage effect"). So more VIX increases take place against a background of a falling stock market than a rising stock market. For ex. in 2021 ytd the VIX increased on 35 days, of which 28 days the stock market (S&P futures) fell and 7 the stock market rose. The VIX decreased on 49 days, of which 41 were stock market up days, 8 were down days. $\endgroup$
    – nbbo2
    Commented May 4, 2021 at 22:22

2 Answers 2

6
$\begingroup$

Variance Premia; disentangled.

Let me address this question a bit differently and bring the question forward: What part (i.e. 'side') of the volatility smile attracts a significant premium in relationship to the underlying uncertainty that it is trading?

To this end, let us define the physical, i.e. empirical (average realized) return semivariance as:

$$ SV_\mathbb{P}^-=\mathbf{E}^\mathbb{P}\left((r-\mu_\mathbb{P})^2\mathbf{1}_{\{Z\leq\mu_\mathbb{P}\}}\right)=\int_{-\infty}^{\mu_\mathbb{P}}(z-\mu_\mathbb{P})^2p(r)dr $$ and define its risk neutral, i.e. option implied, equivalent $SV_\mathbb{Q}^-$ in the same manner. Do the same for the empirical, and priced, upside semivariances likewise. We can now define a downside (and upside) semivariance risk premium as the:

$$ \begin{align} DSP(r)&\equiv SV_\mathbb{P}^-(r)-SV_\mathbb{Q}^-(r)\\ USP(r)&\equiv SV_\mathbb{P}^+(r)-SV_\mathbb{Q}^+(r)\\ \end{align} $$

In a nutshell: DSP is the average realized profit (ex trading cost) from buying downside semivariance options in the market; USP is the average realized profit from buying upside semivariance options in the market. A portfolio of both, upside and downside, replicates a VIX position (more or less).

We can now re-use the VIX development and arrive at a put/call based pricing formula for the downside (or upside) priced semivariance:

$$ SV_\mathbb{Q}^-=\mathrm{E}^\mathbb{Q}\left({\left(\log\left(\frac{S_T}{S_0}\right)-\mu_\mathbb{Q}\right)^21_{\left\{\log\left(\frac{S_T}{S_0}\right)\leq \mu_\mathbb{Q}\right\}}}\right)=\int_0^{S_0e^{\mu_\mathbb{Q}}}\frac{1-\log\left(\frac{X}{S_0e^{\mu_\mathbb{Q}}}\right)}{\frac{1}{2}B_0(T)X^2}Put(X)\mathrm{d}X $$ with $X$ the option strike, $\mu_\mathbb{Q}$ the risk neutral drift, $S_0$ today's index level and and $S_T$ the index level at expiry. We finally define some measure for the empirically observed semivariance and are in a position to test the premia, i.e. ask the question:

Is the Downside (upside) semivariance premium significant?
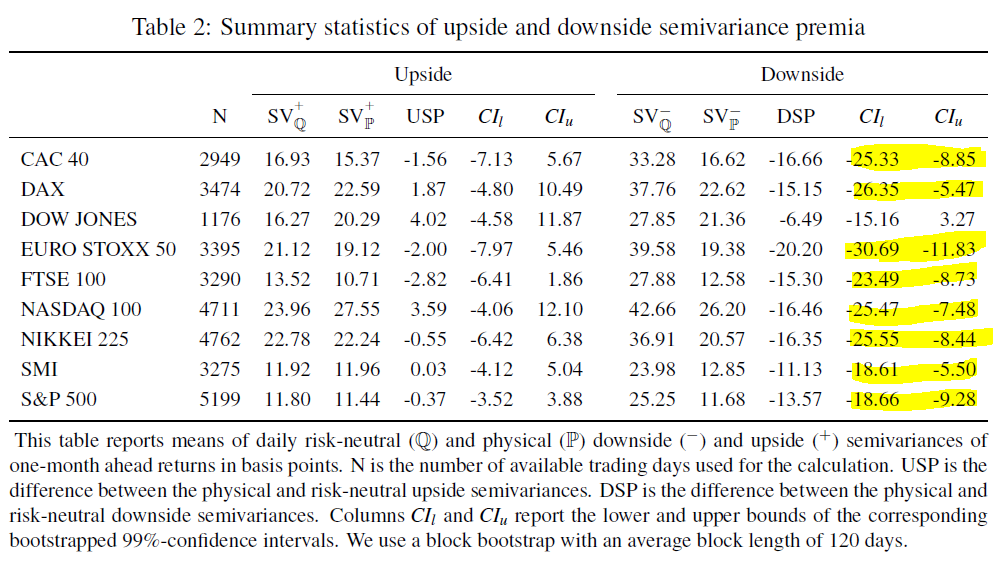
enter image description here Source: https://www.sciencedirect.com/science/article/abs/pii/S0378426620301412

For major stock market indices, we find quite similar results (see below): Whereas the upside semivariance premium is often quite small and not statistically significant (99% confidence interval around zero), the downside semivariance premium is economically and statistically significant. Hence:

there is a general pattern in investor behavior to insure against large return innovations in the negative but not in the positive return domain.

and even more so:

the major part of the variance premium is paid to insure against extreme negative return realizations. For a return horizon of 30 days, the variance premium for returns below -15% amounts to values of around -15 bp for all considered indices.

HTH a bit?

NB: ... It would be an interesting endeavor, of course, to replicate this analysis using stocks and stock options.

$\endgroup$
1
$\begingroup$

I think you are mixing up a few things.

  • As @noob2 pointed out, there is a negative correlation between price changes and IVOL changes (what explains this is not 100% clear in the literature - however, a simple explanation is that markets fall much more quickly than they rise).
  • The largest positive daily percent changes in S&P500 were all in times of turmoil and declining markets. This may sound surprising but is commonly referred to as volatility clustering. The link has some useful details. It is again an implication of markets falling usually much more quickly than they rise.
  • VIX is computed like a variance swap (all options across the strike spectrum). For equity (indices), the surface is skewed towards OTM puts (higher IVOL for OTM puts compared to OTM calls) most of the time (if not all times).
  • I looked at the Vol surface of Gamestop during the days surrounding 27th of Jan and 10th of March 2021 and even in these extreme "greed or bullishness" times, OTM puts were MORE expensive (higher IVOL) than OTM calls.
  • Ignore at the money options (or that the price of calls is driven up). Your observation holds a lot more general. You can look at P.409 chapter 19 “OPTIONS, FUTURES, AND OTHER DERIVATIVES - John C. Hull: 8th edition”. In plain English, IVOL from a European call option should be the same as that calculated from a European put option when both have the same strike price and maturity. A deep OTM put will be a deep ITM call. If you have the same strike and same tenor, theoretically constructed Vol surfaces will show the same IVOL. You can have a look here for a more "formal" explanation. This need not hold with listed options, as prices (especially in illiquid markets) can be quite erratic but the general logic is the same - OTM put IVOL will be higher than OTM call vol.
  • Implied Volatility is a measure of (forward looking) uncertainty. In terms of VIX and S&P500 it seems very unrealistic to assume a scenario that is remotely related to Gamestop.
  • Even if S&P500 would be expected to have swings similar to Gamestop, OTM puts will still be relatively more expensive, which should in my opinion be interpreted as (permanently) increased demand for puts.
  • Last but not least, I had a look at Gamestops Put/call open interest (all option contracts that have not been closed, liquidated, or delivered) ratio. It went from roughly 1.05 at the beginning of 2021 to a peak of ~6.8 at the end of January. That means, no matter how much greed or bullishness there may have been, demand for puts actually dwarfed the demand for calls during this time. Again an implication that (perceived) risk or fear matters most.
$\endgroup$
6
  • 1
    $\begingroup$ "IVOL is a measure of (forward looking) uncertainty". I never understood why for three reasons: Isn't implied vol simply the $\sigma$ parameter in the BS formula that yields the observed market price? Thus, IVOL would only predict future realized VOL if (1) the market followed a GBM to start with (which it doesn't?) I understand that $\sigma^Q=\sigma^P$ in the BS world but (2) in reality the $Q$ (implied) and $P$ (physical) world are very different (risk premiums). Finally, (3) there's a smile/smirk for most assets. Which of these $\sigma$-values is the right measure for forward-looking IVOL? $\endgroup$
    – Alex
    Commented May 5, 2021 at 7:23
  • $\begingroup$ No, IVOL does not predict future realized vol. If you plot (quoted) IVOL and strike, you see what is called a smile or skew. you can look here for s stylized example. Realized vol is only one number. So ignoring all else, this cannot be true already. Saying it is a measure of uncertainty is not 100% precise either. Just suits the question. In reality IVOL depends on lots of things, including supply and demand. You can google Volatility Risk Premium for papers. $\endgroup$
    – AKdemy
    Commented May 5, 2021 at 7:47
  • $\begingroup$ With BS, (GBM) you have lognormal distribution of returns, meaning that the logarithmic return is normally distributed. In a nutshell, the Vol Smile mainly exists because this is not true. FX actually directly quotes IVOL in a way and adjust for skewness and kurtosis. All of these $\sigma$ are correct in the sense that they are appropriate for the moneyness (delta) level you look at. $\endgroup$
    – AKdemy
    Commented May 5, 2021 at 7:53
  • $\begingroup$ Yeah, because of all the points you mention (and that I introduced in my comment), the log normal GBM assumption, the risk premiums and the smile/smirk, you’d agree that implied volatility has no power whatsoever to predict future uncertainty (volatility)? If a particular strike for Apple calls is quoted with 21% for 30 days, then this tells me nothing about the standard deviation of future real world returns? $\endgroup$
    – Alex
    Commented May 5, 2021 at 8:52
  • $\begingroup$ At the time of writing (1M is theoretical so it will vary across tools) ATM 1M vol on Apple is ~ 26%. That for 80% moneyness is +71%. Looking at 71% in an isolated manner will tell you close to nothing about (SD) of future returns, correct. You can for example compute Option-Based Risk-Neutral Distributions based on Breeden Litzenberger's work. I do not really see the connection to the question though, which asked if it really is an indicator of fear. $\endgroup$
    – AKdemy
    Commented May 5, 2021 at 9:04

Your Answer

By clicking “Post Your Answer”, you agree to our terms of service and acknowledge you have read our privacy policy.

Not the answer you're looking for? Browse other questions tagged or ask your own question.