4
$\begingroup$

I need help understanding why there are many different values for a specific metric reported by a company's 10-K or 10-Q in the EDGAR database.

I've downloaded the entire US equity universe in JSON from the SEC website here (Bulk Data).

Here is my code for getting the Diluted Earnings Per Share of a company in 2016

import json
import pandas as pd

f = open('CIK0001511198.json')
data = json.load(f)

df = pd.DataFrame(data['facts']['us-gaap']['EarningsPerShareDiluted']['units']['USD'])

df = df[(df['form'] == '10-K') | (df['form'] == '10-Q')]

df[df['fy'] == 2016]

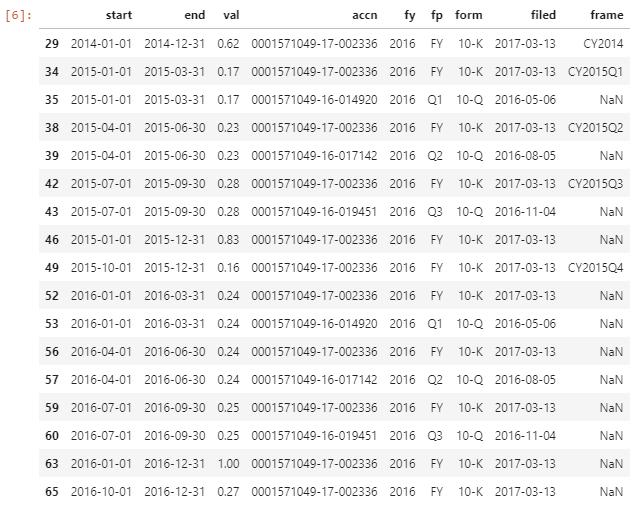
enter image description here

I was expecting 4 rows with three 10-Q and one 10-K... some values are different even within the same form id (accn)

Can someone explain why there are many different values and what the differences are?

Cheers!

$\endgroup$

1 Answer 1

1
$\begingroup$

You should check Bamsec for one of the stocks manually to see what's going on, and what the "val" column is actually referring to. Manually compare those results w/ what you see here.

It could be something like the company amending the 10-K which leads to two entries in this dataset.

It could be that the company reports data for previous FY as well as current FY inside the same 10-K, which leads to two rows being entered into this dataset for the one report.

$\endgroup$

Your Answer

By clicking “Post Your Answer”, you agree to our terms of service and acknowledge you have read our privacy policy.

Not the answer you're looking for? Browse other questions tagged or ask your own question.