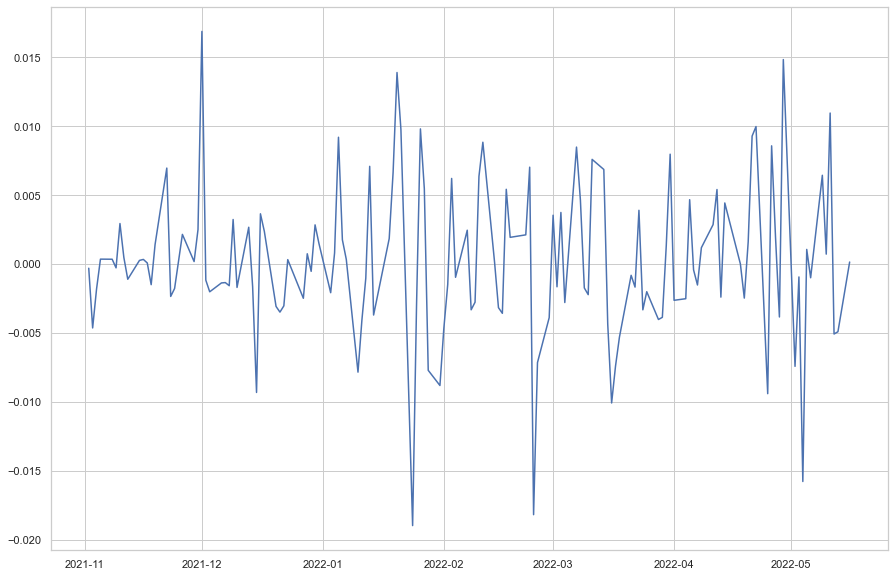
I'm trying to construct a model which shows how much the closing price of a security ($P_t$) differs from the VWAP of that security on that day ($VWAP_t$). I'm calling this measure the "VWAP Premium": $$VWAP_{premium} = \frac{VWAP_t}{P_t}-1$$ By simply plotting this for the MSCI ACWI ETF, I see that it exhibits heteroskedasticity, but not necessarily any other trend:
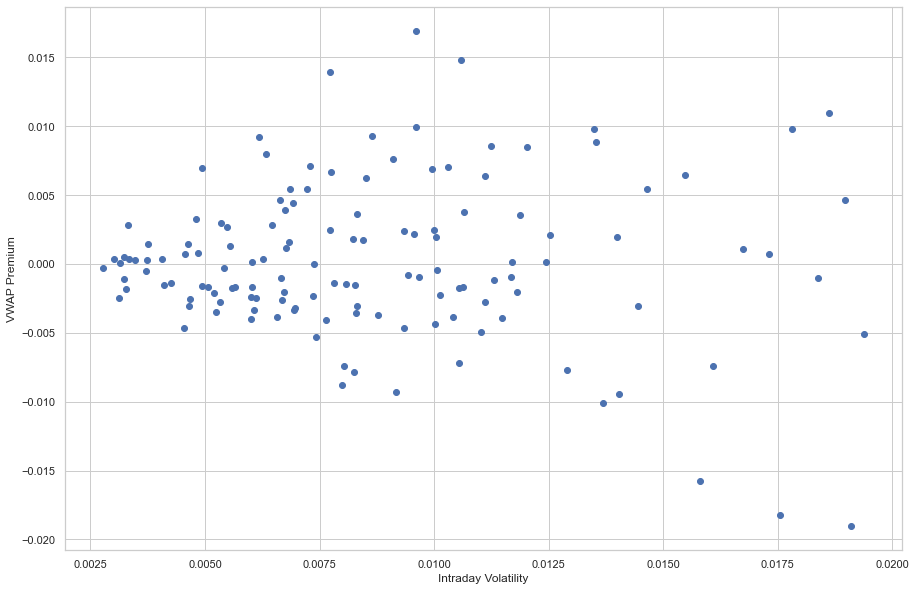
One thought I had was that intraday volatility ($\sigma_{ID}$) could help signal these larger absolute values of $VWAP_{premium}$, so I plotted the scatterplot and it does indeed look like that's the case:
Days with larger intraday volatilities also are more likely to have larger absolute VWAP Premiums, which is intuitive enough. My question is, how is this model fitted? It's not a GARCH model, since the heteroskedasticity is not dependent on prior volatility, but on another variable altogether. It seems to me like this would be something like:
$$VWAP_{premium} = (\sigma_{ID})(\sigma_{VWAP})$$
Is there a simple way to fit this model in Python?


