I understand that stocks' returns are not normally distributed. However, is there any method that we can rescale the stocks' returns so they look more like normal distributions?
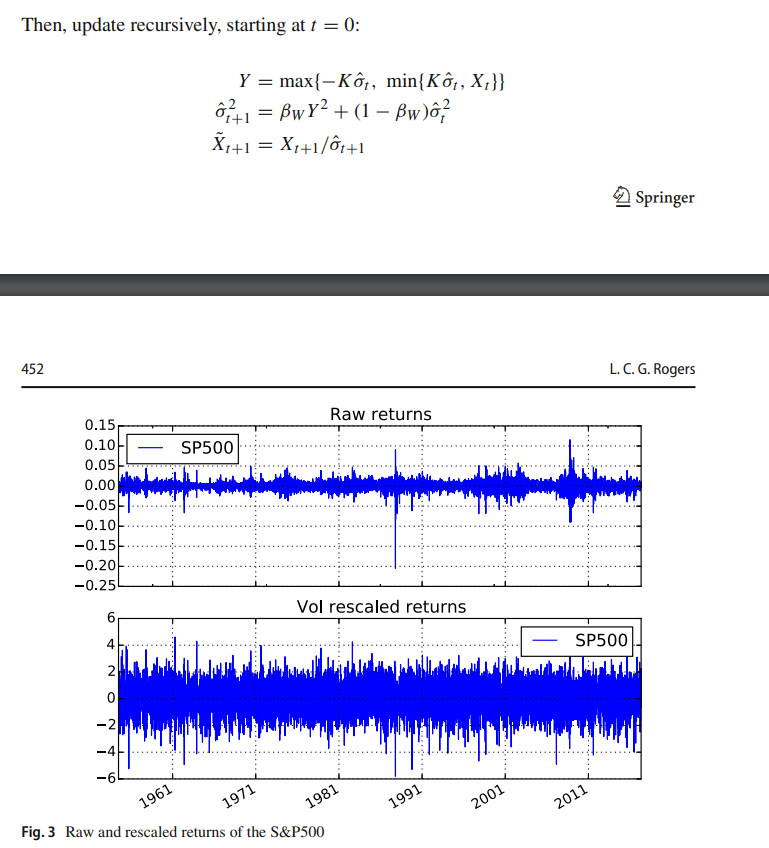
I managed to find a paper talking about this: https://link.springer.com/content/pdf/10.1007/s10203-018-0230-3.pdf where the author rescaled the SP500 returns as follows:
As you can see, he managed to scale the returns on the extreme periods (for example Black Monday 1987) to look more like normal distributions.
I tried to replicate this method using Python using the same parameters as in the paper with K = 4, Beta is 0.025. N was not specified but I chose N to be 100.

SP500['returns'] = np.log(SP500['Adj Close']/SP500['Adj Close'].shift(1))
SP500['returns_sq'] = np.square(SP500['returns'])
SP500.loc[:, 'vol'] = 0
SP500.loc[:,'Vol_rescaled_returns'] = 0
K = 4
Beta = 0.025
SP500.loc[101,'vol'] = np.sqrt(SP500.loc[1:101,'returns_sq'].mean())

for i in range(101,len(SP500)-1):
  Y = max(-K*SP500.loc[i,'vol'],min(K*SP500.loc[i,'vol'],SP500.loc[i,'returns']))
  SP500.loc[i+1,'vol'] = np.sqrt(Beta*(Y**2) + (1-Beta)*(SP500.loc[i,'vol']**2))
  SP500.loc[i+1,'Vol_rescaled_returns'] = SP500.loc[i+1,'returns'] / SP500.loc[i+1,'vol']
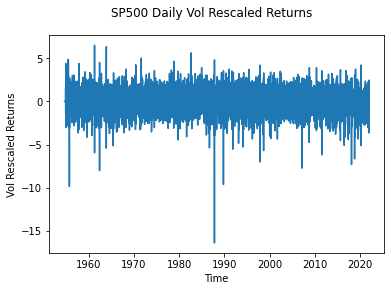
However, my result is different from the paper, as shown below with significant negative returns on Black Monday around -16 while on the paper it's -6. Is there anything wrong with my code above? I have checked a few times but it seems quite straightforward or is there a problem with this method? Thanks a lot!


