3
$\begingroup$

I'm currently backtesting a mean reversion pairs trading strategy. However, instead of simple long or short trading signals, I'm using multiple "levels", where the further away the spread is from the mean, the more positions I put on.

However, since the Sharpe Ratio (and other performance metrics) only use percent returns, it only captures whether or not I'm in or out of the market, since regardless of whether or not I'm holding 1 or 10 positions, the percent return is the same.

Is there a way to calculate the Sharpe Ratio while accounting for dynamic position sizing? If not, are there any risk-adjusted performance measures that are able to capture this behavior?

I was thinking of weighting the mean and standard deviation of the daily returns based on the number of positions for each day, but I'm not sure if that's the right approach.

$\endgroup$
1
  • $\begingroup$ How would you trade this with real money? Say you had \$1,000,000 from an uncle. When there is only one trade available, would you buy \$100,000 of stock A and short 100,000 of stock B, or some other amounts. WIth the spare cash earning the risk free rate? Or go long 1,000,000 and short 1,000,000? When you have 10 opportunities what would you do? The rule for dollar allocation you decide to use will determine your risk and return. (And the Sharpe Ratio is just the ratio of those two). $\endgroup$
    – nbbo2
    Commented Oct 15, 2018 at 18:07

3 Answers 3

4
$\begingroup$

To calculate the sharpe ratio of a strategy backtest you should ultimately go back in $ space and calculate for every day your PNL (profit and loss), not returns, because at the end of the day this reflects better what you practically will do. Important properties of your backtest are that

  1. it needs to be self-financing: no cash is injected from one period to the next so all your changes in portfolio allocation need to be financed by the variation of your portfolio value. This is important for instance if you backtest strategies that roll futures: when you roll from one expiry to the next you need to take into account that the new future and the old future trade at different level (this is also called roll-cost)
  2. properly reflect transaction costs: this will allow you to distinguish between "gross PNL" and "net" PNL and also very importantly will prevent you from selecting strategies that try to monetize signals that are seemingly very robust but too small compared to half-spread say (often signals have very strong predictive power but cannot be monetized because they are too small in magnitude)

at the end of the day, your backtest will give you a series of daily PNL (gross and net) for which you can calculate mean, std dev and sharpe ratio.

Once you know the total pnl you can measure it in relation to other parameters of your strategy (eg: initial capital, maximum gross exposure, maximum drawdown, gross traded volume etc.. etc..) that will give you additional performance metrics which can be indicative of various properties of your investment strategy

$\endgroup$
0
$\begingroup$

Calculating the Sharpe ratio is done a posteriori-that is, after the strategy has been run forward. If dynamic position sizings improve the realized Sharpe ratio, then there may be some sort of interaction between the spread size and expected forward return.

But that's just one small point of distinction. A slightly different question might be phrased as such: How to find maximize the Sharpe ratio for a given strategy?

There are different ways to answer this question. In a non-smooth universe, such as that of historical/realized stock returns, there may be an optimal solution which is not robust. However, if expected returns (and variances) can be defined by smooth functions, there may be analytical solution(s) which maximize the expected Sharpe ratio.

The math to maximize the Sharpe ratio can be quite complicated depending on the level of sophistication and the modeling assumptions used. But to start off, I would recommend reading on optimal Kelly bets (i.e., those which maximize the log rate of return) for a one-stock portfolio, and then branching off from there.

So until I have more time to work this through, I'll leave it to others to answer more thoroughly.

$\endgroup$
0
$\begingroup$

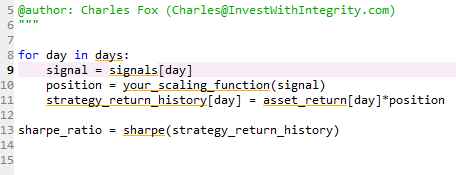
Yes, I've tried to calculated it analytically for another question where the scaling is linear. However, I haven't had a chance to write a simulation to check my work.

Roughly, a backtest would roughly look like:

psuedo code

Don't forget to adjust for financing costs!

$\endgroup$

Your Answer

By clicking “Post Your Answer”, you agree to our terms of service and acknowledge you have read our privacy policy.

Not the answer you're looking for? Browse other questions tagged or ask your own question.