12
$\begingroup$

It is well known that the variance of asset returns, $\sigma^2$ (whose square root is volatility), is easier to estimate than the asset mean $\mu$ (also known as expected return) because the mean of asset returns is very difficult to estimate.

Why is this the case, given that the sample estimator for volatility itself contains the sample estimator of the asset mean in its formula?

$$\hat{\sigma} = \sqrt{\sum_{i=1}^n \frac{(x_i-\hat{\mu})^2}{n-1}}$$

Shouldn't the estimation error from $\hat{\mu}$ seep into the estimation error of $\hat{\sigma}$? If not, why doesn't it?

$\endgroup$
1
  • $\begingroup$ Note that in the case of IID normal returns, the sample mean and variance are independent, despite the sample variance being in some sense a function of the sample mean. $\endgroup$ Commented Nov 9, 2020 at 3:34

9 Answers 9

16
$\begingroup$

Let me add two points to Quantoisseur's answer.

Standard Errors

The difference between estimating variances and means is that the standard error of the variance estimator depends on the size of the sample (number of observations), whereas the standard error of the mean depends on the length (or duration) of the sample, see here. So, if you use finer and finer data points (up to high frequency data), you typically improve the accuracy of the variance estimator (see, for example, realised variance) but not the accuracy of the mean estimator. For the latter, you have to extend the estimation sample (time horizon) as a whole.

Autocorrelation

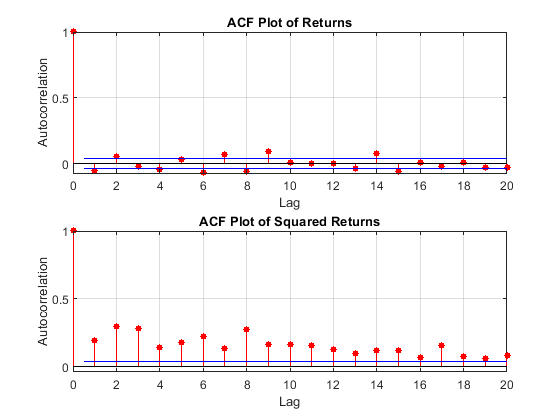
Let's talk about conditional mean and variance. Please look at the autocorrelation plots of IBM's returns below. As you see, the returns themselves hardly depict any significant autocorrelation. Thus, you cannot really use historical data to forecast future expected returns. However, squared returns (which proxy the unobservable variance) depict significant autocorrelation. Thus, historical squared returns carry some information about future conditional variances. That's why GARCH models work: squared returns are autocorrelated. Recall that $\mathrm{Var}[R]=\mathrm{E}[R^2]-\mathrm{E}[R]^2\approx \mathrm{E}[R^2]$.

enter image description here

Impact of Mean on Variance Estimation

My first point with the standard error is that we can't estimate the mean of a time series of returns accurately. It may be 1% or 3% or -2% (often we can't even be sure about the sign!). All are very well possible. But does it matter for the variance? By definition, $\mathrm{Var}[R]=\mathrm{E}[(R-\mathrm{E}[R])^2]=\mathrm{E}[R^2]-\mathrm{E}[R]^2$. Now, if you square 0.01, 0.03 or -0.02, you get negligible numbers. So, despite having potentially huge standard errors in the mean estimation (3% is kind of three times as big as 1%), it doesn't really impact the estimation of the variance because the variance deals with squared quantities and returns are sufficiently close to zero.

$\endgroup$
28
  • 2
    $\begingroup$ @develarist I'm sorry, please have a look at my edit. Does this help? In principle, you're right and it is a problem. In reality however, the mean is so close to zero that it has hardly any impact. $\endgroup$
    – Kevin
    Commented Aug 21, 2020 at 13:05
  • 1
    $\begingroup$ @kurtosis I'm not sure what you mean. I cite from the paper's discussion: While there may be unbiased estimators for the parameters of the volatility whose standard errors can be reduced by increasing the size of the sample $N$ (see Florens-Zmirou (1993) for example), all unbiased estimators of the excess return will have standard errors fundamentally bound by the length of the historical period $T$. So, mean estimation depends on length (call it duration if you want to) whereas the standard error of the point estimator for the variance depends on the number of observations (sample size). $\endgroup$
    – Kevin
    Commented Aug 21, 2020 at 17:50
  • 3
    $\begingroup$ @kurtosis Okay, I didn't say always but I tried to clarify a bit. Thanks for pointing it out. Hardly anything holds always ;) The whole point of using high frequency data and estimating realised variance (and noise-robust and jump including generalisations) is that it provides an improved estimator for the variance: you keep the time horizon (duration) fixed but you sample the price at higher frequencies. But yeah, always would be bit bold, I agree :) $\endgroup$
    – Kevin
    Commented Aug 21, 2020 at 18:01
  • 3
    $\begingroup$ @kurtosis Okay, your first point clarifies then if you have a look at the rest of the paper and don’t just look at the abstract :) Regarding the finer subsamples, I fully second what you say! If you look at volatility signature plots, samples below 5 min go wild. Too much micro structure noise. There are some noise robust RV estimators (realized kernels, multi-scale RV estimators, sub-sampled RV estimators, pre-averaging estimators, ...) but I think we're going a bit off topic. The key is that mean estimation depends on the time horizon and the variance on the number of samples. $\endgroup$
    – Kevin
    Commented Aug 21, 2020 at 18:13
  • 1
    $\begingroup$ @kurtosis Lecturers at my university research high frequency methods, that how I learnt a bit from them :) But it's certainly not my research area either... $\endgroup$
    – Kevin
    Commented Aug 21, 2020 at 18:21
6
$\begingroup$

The answer is not statistical. In almost every other area of statistics, estimating the mean is easier (i.e. it can be estimated with higher precision) and estimating higher moments like variance (and thus volatility), skewness, kurtosis, etc. is harder -- sometimes much harder.

The key points that make financial statistics (or financial econometrics, if you prefer) different are market efficiency and competition.

Market Efficiency

An efficient market is one where all prices are fair: you cannot find prices which are clearly wrong in light of risk.

How do markets become efficient? Suppose you knew a stock was going up. You would buy the stock -- until doing so no longer was expected to make money. The same goes for shorting a stock you knew would fall. If your information were not guaranteed, you might still take some risk by buying or selling (though maybe less so). Therefore, your trading also is tempered by uncertainty.

Competition

You are not the only person trying to make money; other people are also always looking for information that will help them make money. If two or more people learn of some information, the first person to trade and move prices will earn money while the late person will earn no money. That makes people compete to be the first to trade on information. Over all of the people in the market, that means prices quickly incorporate new information.

Apart from the times when people get new information, prices are fair: they have incorporated all of the information. When new information arrives, people trade on that to make money which changes prices... until prices are again fair. Competition makes market prices fair and fair prices make the market efficient.

Predicting the Mean

The result is that predicting the movement of a stock is difficult, especially most of the time when you lack information. Furthermore, we think prices adjust rapidly to new information so most of the time we do not know where prices will go next.

Sure, you expect to get a return at least as good as the risk-free rate, but how much more? That is difficult to determine. If it were not difficult to determine, you would be back to trading until prices were fair.

Together, these economic realities have two implications. First, predicting the mean return of a stock is difficult. If it were not so, trading and making money would be easy. Second, guessing when a stock will move a lot is even more difficult; hence most investors say it is easier to just hold a stock for a long period of time and (hopefully) benefit from those changes instead of trying to time them.

Volatility

So now we can understand why predicting the mean return is difficult. It is not so much that predicting volatility is easy but more that predicting volatility is easier than predicting the mean for asset returns.

At this point, you might say "but then why can't I make easy money trading the VIX?" (or other volatility-related instruments). Competition and market efficiency again make that difficult: those forces keep the VIX and other volatility-related instruments fairly priced. That helps us make better estimates of volatility over long stretches of time: hours, days, months, and so on.

However, if you tried to predict the VIX over minutes and trade on that... you would likely find it just as difficult as predicting stock returns.

$\endgroup$
15
  • $\begingroup$ Nice answer. Clarifying question: when you say returns are not predictable you mean conditional mean equals unconditional mean (so you don't find variables that predict returns) that unconditional mean is small or both? I guess predicability and the fact that unconditional mean is hard to estimate seem related but separate points. $\endgroup$
    – fes
    Commented Aug 21, 2020 at 17:51
  • 2
    $\begingroup$ So if markets were informationally inefficient, you'd argue that estimating the means would be much easier? The US stock market is surely pretty efficient, but what about some emerging markets? They are probably much less efficient. Would you say it would be quite easy to estimate the unconditional mean of returns in these markets? $\endgroup$
    – Kevin
    Commented Aug 21, 2020 at 18:27
  • 1
    $\begingroup$ I'm still not fully convinced by the link between the EMH and unpredictable means. Firstly, long-term returns are predictable. Secondly, predicting weather reliably is quite difficult (at least as far as I understand it. I live in the UK: predicting tomorrow's weather is utterly impossible! :D) so I don't see the link to weather derivatives. Finally, suppose behavioural finance is right. All agents are completely emotion driven. Markets are the opposite of efficient. I can’t see how this implies predictable means. $\endgroup$
    – Kevin
    Commented Aug 21, 2020 at 19:29
  • 1
    $\begingroup$ I agree with you in practice. I just meant that many asset pricing theory papers, e.g. Campbell-Cochrane habit model, or similar multi agent models, assume the mean is known. So in theory you can have an efficient market with known mean. $\endgroup$
    – fes
    Commented Aug 22, 2020 at 14:49
  • 1
    $\begingroup$ Assuming a known mean (say, the risk-free rate -- which I mention as a baseline for estimation) does not imply there is not a better estimate of the mean which is difficult to find or short-lived. It just says "we cannot determine a better estimate so we will go with this." Most papers I have seen assume nothing more than the risk-free rate or you get a money pump and degenerate solutions to the models. As for Campbell-Cochrane... the poor performance of consumption-based models does not recommend them. Great idea; awful performance. $\endgroup$
    – kurtosis
    Commented Aug 22, 2020 at 14:57
4
$\begingroup$

A simpler answer is thus. There are known historical values for the past year for the mean. It's simply the end of year value divided by the beginning value.

However, we can't improve the estimate of the mean by looking at, say, the daily returns and aggregating them up to 250 days of trading to make a better estimate of the mean (return): it will simply end up being those two values divided.

However, with variance (or stdev) we CAN look at weekly values and average them to get a better read on the value than we can by looking at monthly data, etc..

$\endgroup$
2
  • $\begingroup$ This is the only correct answer. $\endgroup$
    – Freelunch
    Commented Nov 12, 2020 at 7:40
  • 1
    $\begingroup$ @Freelunch Isn't this simply the first point of Kevin's answer? Higher sampling frequency improves volatility estimation but not the mean estimation? The mean requires a longer time horizon? $\endgroup$
    – Alex
    Commented Nov 12, 2020 at 11:29
3
$\begingroup$

The sample variance and standard deviation (volatility) formulas are:

enter image description here

If your question is why is volatility easier to predict than returns, the intuitive answer is because the numerator is squared and thus has only positive values. This simplifies the problem as now I don't have to worry about predicting the sign of the return, only the size.

$\endgroup$
2
  • 9
    $\begingroup$ This is not right. Neither the numerator being squared nor positivity has anything to do with the ease or precision of estimating volatility. In all of statistics apart from economics, the mean is easier to estimate and variance is harder to estimate -- in the sense that we can get more precise estimates of the mean than the variance from the same data. $\endgroup$
    – kurtosis
    Commented Aug 21, 2020 at 16:51
  • 2
    $\begingroup$ True, I don't know from an estimation perspective. The question was confusing and my answer was in case it was about future predictions, not estimation. $\endgroup$ Commented Aug 21, 2020 at 18:16
2
$\begingroup$

In fact, a standard way to estimate the volatility does not use the mean at all (the mean is set to zero in the formula), because, as pointed out in @Kevin's answer, it really makes no difference, so the premise of the question is a bit fraught. It should be noted that the market mean return is extremely robust (and very close to constant, at around 4 basis points per day) over very long periods (as in, several decades), so the answer to the question depends on what time horizon you are looking at.

$\endgroup$
2
$\begingroup$

This is largely because the variance of stock returns is high relative to their mean.

The idea that stock return means are harder to estimate is old and was already known before high frequency data, or even GARCH models, were widely used. The point is made e.g. in this 85 paper by Jorion who writes:

On the other hand, uncertainty in variances and covariances is not as critical because they are more precisely estimated

However, I believe the point is even older.

Let me consider a simple example. Assume stock returns are i.i.d. and follow a normal distribution $r \sim N(\mu, \sigma^2)$, where both the mean and variance are unknown. The standard confidence interval for the mean is

$$[\hat{\mu} - t_{n-1,\alpha/2}\frac{s}{\sqrt{n}},\hat{\mu} + t_{n-1,\alpha/2}\frac{s}{\sqrt{n}}],$$

where $t_{n-1,\alpha/2}$ is the $\alpha/2$-percentile t-stat with $n-1$ degrees of freedom. The confidence interval for standard deviation uses the chi-square distribution and is given by (see here)`

$$\left[\sqrt{\frac{(n-1)s^2}{\chi^2_{n-1,\alpha/2}}},\sqrt{\frac{(n-1)s^2}{\chi^2_{n-1,1-\alpha/2}}}\right].$$

Consider the monthly returns of the S&P 500 (long-run mean roughly $0.8\%$ and standard deviation $4.5\%$). Assume you sample 20 years of returns, i.e. $n=240$. Assume your estimators happen to get the mean and standard deviation correct. Now the $95\%$-confidence interval for mean becomes

$$[0.23,1.37].$$

The confidence interval for the standard deviation becomes

$$[4.13,4.94].$$

You can see that the confidence interval for standard deviation is relatively tighter. But this is not the case for arbitrary values of mean and standard deviation. Rather the stock return mean and standard deviation happen to be such that the latter bound is relatively tighter because the mean is low relative to standard deviation.

If you increase the stock return mean to say $10\%$ monthly holding standard deviation constant, the confidence interval for mean becomes relative tigher than that for the standard deviation. If you look at any other normal distribution, you might easily find that you estimate the mean with greater precision than standard deviation. As the answer by kurtosis suggests, in other contexts, means are often easier to estimate than variances.

$\endgroup$
6
  • $\begingroup$ @RichardHardy You have the square root because it is the confidence interval for standard deviation. The latter was just a typo. I corrected it. Thanks! $\endgroup$
    – fes
    Commented Nov 9, 2020 at 9:40
  • $\begingroup$ @RichardHardy Another typo; corrected. Thanks! $\endgroup$
    – fes
    Commented Nov 9, 2020 at 9:51
  • $\begingroup$ What do you think about the answer of Dave Harris? I have also posted a related question. $\endgroup$ Commented Nov 12, 2020 at 7:42
  • $\begingroup$ @RichardHardy I think he could do more to demonstrate how the answer depends on the parameters of the distribution. The argument that looking at confidence intervals is pointless because there is a continuum of them is unorthodox and most statisticians would disagree. It would be similar to saying that 1% value at risk is pointless because you as well look at 5% value at risk. $\endgroup$
    – fes
    Commented Nov 12, 2020 at 9:59
  • $\begingroup$ Right. The way you construct confidence intervals is based on a very concrete mapping between the parameters of the distribution and the interval. Then we essentially can discuss the interval and the parameters interchangeably. But his main point clarified in the edit seems to be that the original problem is an apples-to-oranges comparison. That is an interesting point and a troubling one if we accept it, don't you think so? $\endgroup$ Commented Nov 12, 2020 at 11:02
2
$\begingroup$

I am reading this 2.5 months after the question was asked but I still see some confusion in the answers (or at least I am confused by them).

  1. The OP claims that the variance of asset returns is easier to estimate than the mean, but the statement is not formulated mathematically. The currently available answers do not formulate it mathematically either. This makes a rigorous discussion difficult.
  2. More specifically, the central concepts are mean and variance of asset returns. Theoretical mean (mathematical expectation) and variance only make sense as parameters of a statistical/probabilistic model of the data generating process (DGP). The model is not given by the OP nor by the currently available answers. Without a rigorous definition of the estimand, a discussion of ease of estimation is problematic.
  3. Moreover, neither the OP nor the currently available answers define estimation precision mathematically nor provide formulas of estimation precision for mean and variance.
  4. Even when the theoretical mean and variance are well defined mathematically, they are not observed. Thus, evaluating estimation precision is nontrivial; we cannot just compare the estimate to the actual value since the latter is latent. At least some answers seem to conflate the observed realization of an asset return with the theoretical mean of the underlying distribution. (However, there may be models that define variance in terms of observed data, and then variance might be observed given the relevant data.)
  5. In a similar vein, estimation of mean is not the same as point prediction. Point prediction can be hard if variance is large even if the theoretical mean is known. Therefore, large prediction errors do imply the mean has been estimated poorly.

While this does not answer the OPs question directly, it hope it guides the discussion towards a rigorous answer.

Update: see a related question here.

$\endgroup$
8
  • $\begingroup$ "Mean and variance only make sense as parameters of a statistical model"? That's the first I have heard such a statement. $\endgroup$
    – Igor Rivin
    Commented Nov 7, 2020 at 21:33
  • 1
    $\begingroup$ @IgorRivin, thanks for your comment. I have made the statement more rigorous. $\endgroup$ Commented Nov 8, 2020 at 11:13
  • $\begingroup$ I think I understand your statement better (but maybe I am wrong still) - there is always a sample mean, but due to heteroscedacity it is not clear what it is we are estimating. $\endgroup$
    – Igor Rivin
    Commented Nov 8, 2020 at 14:39
  • 1
    $\begingroup$ @IgorRivin, indeed, without further assumptions on the DGP, a time series is an ordered sequence of random variables the relationships between which are completely arbitrary. Thus when we have an observed time series, we have a single observation for each of the corresponding random variables. Estimating any parameter of a distribution of a random variable from a single observation is problematic, to put it mildly. Thus we need additional assumptions about the DGP to make connections between the random variables and to decrease the number of parameters characterizing the time series. $\endgroup$ Commented Nov 8, 2020 at 16:05
  • 1
    $\begingroup$ The answers so far seem to suggest there's something to take away from each of them, but even when doing this, I don't see the overall picture being any more coherent. Wrapping my head around arguments contrasting number of sample observations and time frequency really do need more thorough exposition via formulas and more than one example. A statistical answer but directed at financial returns really is a must $\endgroup$
    – develarist
    Commented Nov 12, 2020 at 11:06
1
$\begingroup$

I would like to posit a more straightforward answer, it is a mathematical illusion.

Although this can be solved through formal theory because the distributions are known, doing so would create a long post. Instead, it can be quickly illustrated through a simulation.

Let us assume that the data are normally distributed. The results depend on that. If they are drawn from a different distribution, then the standard deviation's correction factor will change. The assumption that I am using is that the observations are independent because your formula implies it. This correction would not work for autocorrelated data. Nonetheless, the illustration would work out the same in the end, and independence means less work for me.

The unbiased estimate of the mean is $$\bar{x}=\frac{\sum_1^Nx_i}{N}.$$

The unbiased estimate of the variance is $$s^2=\frac{\sum_1^N(x_i-\bar{x})^2}{N-1}$$

The unbiased estimate of the standard deviation is $$s=\frac{\sqrt{ \frac{\sum_1^N(x_i-\bar{x})^2}{N-1}}}{\sqrt{\frac{2}{N-1}}\frac{\Gamma(\frac{N}{2})}{\Gamma(\frac{N-1}{2})}}$$

The correction factor is needed because the sampling distribution of the unbiased estimate of the variance is Snedecor's F distribution. In contrast, the sampling distribution of the unbiased estimate of the standard deviation is the Chi distribution. The square root of the unbiased estimator of the sample variance is a biased estimator of the standard deviation.

What I did was create 100,000 samples, each with 1,000 observations, from a standard normal distribution. The code is at the bottom of the answer.

I then calculated the unbiased estimates of the mean, variance, and standard deviation. The distribution of each one is the sampling distribution of the mean, variance, and the standard deviation. So there is now a sample of each with 100,000 observed parameter estimates for each category.

Suppose you look graphically at the sampling distribution of the mean and the variance. In that case, you will see that the distribution of the estimator for the population mean is denser than for the population variance. Of course, you could be more precise by creating descriptive statistics for each estimator.
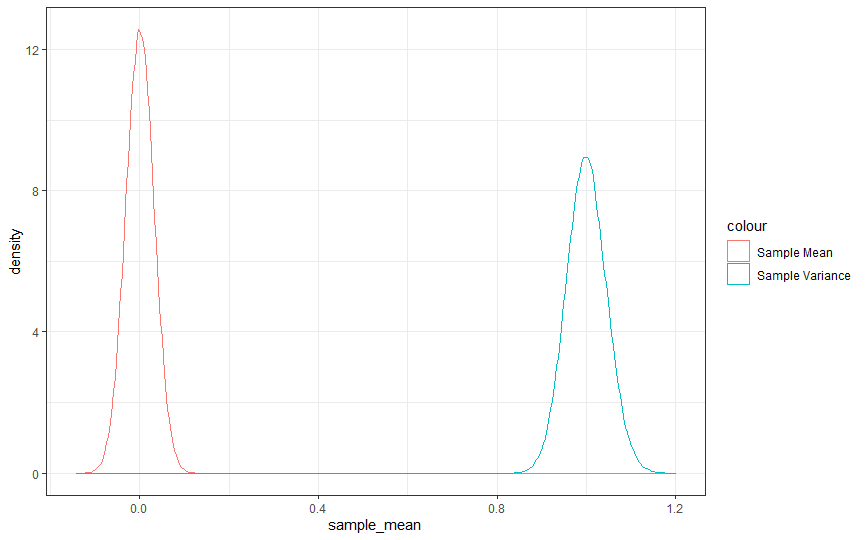
mean and variance sampling

The sampling distribution of the mean is Student's distribution, but the sample is so large that it will have converged to the normal for any practical purpose. The sampling distribution of the variance is Snedecor's F distribution, so though they look quite a bit alike, they really are different things.

Nonetheless, it would appear that the estimator of the mean is more precise than the estimator of the variance. That should be unsurprising because the estimator of the mean is buried inside the estimator of the variance. There are two sources of error.

In this example, the mean's observed squared error is approximately 100 units and of the variance 200 units. So what happens when we compare the squared error of the variance and the standard deviation? The squared error of the standard deviation is approximately 50. Visually, you can see that in the graph below.
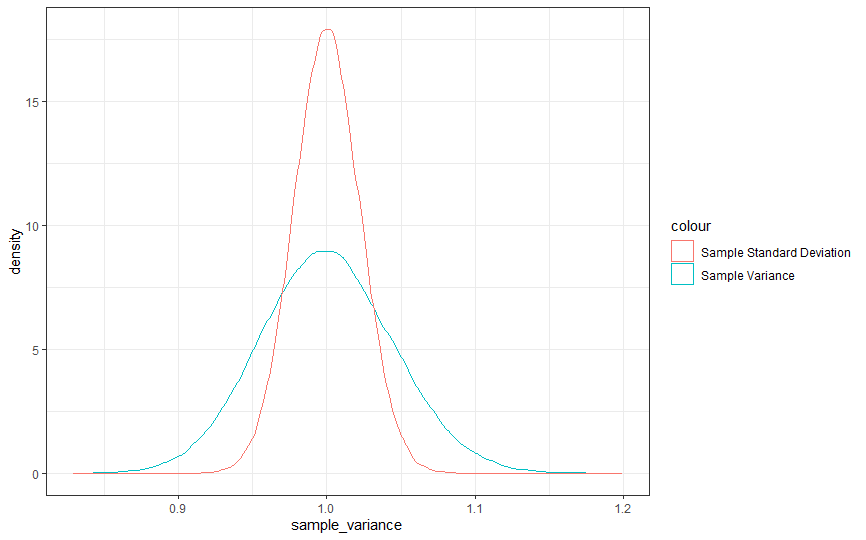
var vs sd

However, this is an illusion, and what should make you suspicious is the missing change of units intrinsic to this way of looking at the problem. You could make all kinds of transformations with the data or the statistics aside from the square root divided by a correction factor. Each one would stretch or shrink the estimation relative to the variance or the mean. It would not imply that they would improve the precision of the estimate.

Note that the above does not imply that there does not exist a transformation or different function that would improve precision or cause an estimator to behave better under some circumstances. Here, though, it is an illusion.

EDIT In response to a comment, I thought I would point out why this question is problematic. Consider a vector $$\theta=\begin{bmatrix}a \\ b\\ c\end{bmatrix}$$ and a second vector $$\theta'=\begin{bmatrix}d\\ e\\ f\end{bmatrix}$$ that may be estimators for some true parameter $\Theta$.

Let us also assume that $\theta\succ\theta'$ under some standard of optimality. Here that standard is that it minimizes the variance of the estimate and it is unbiased. That is far from the only standards that could be used.

It isn't meaningful to talk about the precision of estimation of $a$ versus $b$ in the vector $\theta$, even if one is a transform of the other under the algorithm. I would point out that $s^2$ is a transformation of $\bar{x}$. Each one is estimated in the best way possible under the criteria.

It may be meaningful to discuss the precision and accuracy differences between $a$ and $d$ but not between $a$ and $b$.

The only exception to that case is if a different objective function is chosen. To give an example, if an all-or-nothing loss function were used instead of quadratic loss, the estimator of both the variance and the standard deviation would be improved in precision, though with a loss of accuracy.

If the average loss were used instead of minimizing maximum risk, which is how most Frequentist estimators are chosen, you would get possibly quite different outcomes as well. Indeed, they could not be first-order stochastically dominated by the Frequentist estimators, though they could tie.

If you are finding one easier than another, there is some assumption being strongly violated somewhere. Something else is going on that is being missed and it could be very important.

I, of course, have strong opinions on what that is, but that is not the question presented.

rm(list = ls())
library(ggplot2)

set.seed(500)

observations<-1000
experiments<-100000

x<-matrix(rnorm(observations*experiments),nrow = observations)

sample_mean<-apply(x,2,mean)
sample_variance<-apply(x,2,var)

correction_factor<-exp(log(sqrt(2/(observations-1)))+lgamma(observations/2)- lgamma((observations-1)/2))

sample_standard_deviation<-sqrt(sample_variance)/correction_factor

Frequentist_estimators<-data.frame(sample_mean=sample_mean,sample_variance=sample_variance, 
 sample_standard_deviation=sample_standard_deviation)
rm(sample_mean)
rm(sample_variance)
rm(sample_standard_deviation)


Frequentist_errors<-data.frame(mean_error=(Frequentist_estimators$sample_mean)**2,variance_error=(Frequentist_estimators$sample_variance-1)**2,sd_error=(Frequentist_estimators$sample_standard_deviation-1)**2)

a<-ggplot(Frequentist_estimators)+theme_bw()
b<-a+geom_density(aes(sample_mean,colour="Sample Mean"))+geom_density(aes(sample_variance,colour="Sample Variance"))

print(b)

a<-ggplot(Frequentist_estimators)+theme_bw()
b<-a+geom_density(aes(sample_variance,colour="Sample Variance"))+geom_density(aes(sample_standard_deviation,colour="Sample Standard Deviation"))

print(b)

print(paste0("Observed Squared Error of the Mean is ",sum(Frequentist_errors$mean_error)))


print(paste0("Observed Squared Errors of the Variance is ",sum(Frequentist_errors$variance_error)))

print(paste0("Observed Squared Error of the Standard Deviation is ",sum(Frequentist_errors$sd_error)))
$\endgroup$
8
  • $\begingroup$ The answer by fesman shows that standard deviation is estimated more precisely than the mean for the normal distribution with parameter values that are relevant in models of financial returns. You show that for a particular distribution with particular parameter values, mean is estimated more precisely than variance. How do we reconcile the two answers? And regarding your answer, how exactly should it generalize to an arbitrary distribution with arbitrary parameter values? $\endgroup$ Commented Nov 10, 2020 at 22:05
  • $\begingroup$ @RichardHardy I will provide an edit. $\endgroup$ Commented Nov 11, 2020 at 20:26
  • $\begingroup$ @RichardHardy what I did not address in his post was the issue of the confidence interval. There is an infinite number of possible confidence intervals. The textbook ones usually meet some preferred standard of the author, but are not unique and are only optimal under certain conditions. Addressing confidence intervals would require a full paper. $\endgroup$ Commented Nov 11, 2020 at 21:29
  • $\begingroup$ @RichardHardy to give a trivial example, consider one thousand observations of the sample mean from an unknown distribution with a second moment. One solution for a 95% interval would be to use the standard result using Student's t that is taught in first semester courses. An equally valid confidence interval would be to choose $[x_{25},x_{975}]$. They are both optimal intervals. There is an infinite number of them. Confidence intervals are not measures of precision. Their narrowness or width cannot be interpreted that way. $\endgroup$ Commented Nov 11, 2020 at 21:34
  • $\begingroup$ Thank you for your edit and comments. As I understand you now, it does not make sense to compare estimation precision/accuracy for different target parameters. That would imply all the answers that are actually doing the comparison are missing the point. Is that right? $\endgroup$ Commented Nov 12, 2020 at 7:35
1
$\begingroup$

Similar to what eSurfsnake said: Actually, it is because you can estimate the variance exactly if you increase the sampling frequency enough (given that you use time-series data). This is the idea behind using intraday data to estimate realized variances, for example.

But the mean estimate cannot be improved by simply increasing the sampling frequency. As you increase the frequency from year, to month, to day, to hour, the standard errors increase in proportion. So you gain nothing. In this case, your only alternative is to get a longer sample.

$\endgroup$

Your Answer

By clicking “Post Your Answer”, you agree to our terms of service and acknowledge you have read our privacy policy.

Not the answer you're looking for? Browse other questions tagged or ask your own question.