1
$\begingroup$

Suppose we assume that yields on a zero-coupon bond that matures at time $T$ follow a log-normal process of the type $y(t,T)=y(t_0,T)e^{-0.5\sigma^2t+\sigma W_t}$ under the T-forward measure.

Then, I could express the price of the zero-coupon as: $$P(t,T)=\frac{1}{(1+y(t,T))^{T-t}}$$

For simplicity assume $T-t=n$ where $n$ is some integer.

Is there a name for the distribution of the Bond price for various $n=1,2,..$ ?

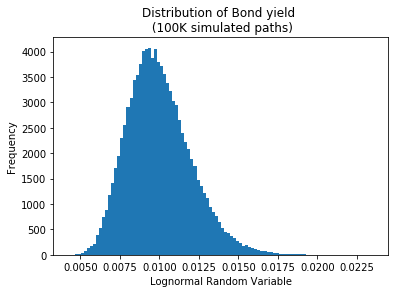
Setting the initial yield to 1%, and running 100K paths, the yield histogram looks like a log-normal distribution (as - of course - expected):

![enter image description here

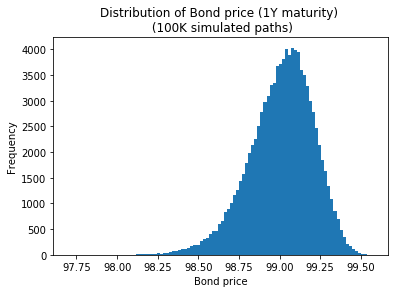
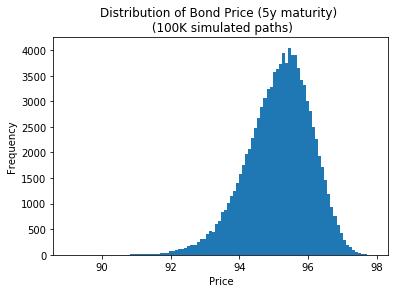
Plotting the Bond price (charts below) sort of looks like "log-normal rotated around its mean" (scaled to a different scale than the yield): does it have a name and a well defined PDF?

enter image description here

enter image description here

My final question (I don't have a lot of experience with pricing Bond options): could the above assumptions (i.e. log-normal yields under the T-forward measure) be used to price a bond option of the type:

$$C_{T_1}=\mathbb{E}^{Q_T}\left[ (P(T_1,T)-K)^{+} \right]$$

What would be the industry standard nowadays for pricing a bond option such as the above, with regard to the price process assumed for the bond price? (would the industry standard be different to assuming the yields are log-normal and modeling the Bond price via the yield as above?)

$\endgroup$

2 Answers 2

1
$\begingroup$

The shifted exponential of a lognormal distribution, just as the exponential of a lognormal distribution is a known in finance because of zero-coupon bond option. I am not aware of it being otherwise known.

You can use a lognormal assumption on the bond price instead of the yield. This will allow you to use the Black formula. You can approximately fit the normal volatility to the expected variance of the yield. The approximation should be good for low time horizon and small volatility.

In all generality, you can see that once fitted to the same ATM option prices, the lognormal yield model will result in a different volatility smile, as a lognormal distribution of the yield is skewed and has increased the probability of high yield (and low price) compared to a normal distribution of the yield.

$\endgroup$
0
$\begingroup$

For everyone's benefit, as per the answer here on Cross Validated, the distribution should be Logit-normal distribution.

$\endgroup$

Your Answer

By clicking “Post Your Answer”, you agree to our terms of service and acknowledge you have read our privacy policy.

Not the answer you're looking for? Browse other questions tagged or ask your own question.