2
$\begingroup$

I understand that stocks' returns are not normally distributed. However, is there any method that we can rescale the stocks' returns so they look more like normal distributions?

I managed to find a paper talking about this: L. C. G. Rogers: Sense, nonsense and the S&P500, Decisions in Economics and Finance (2018) 41:447–461

https://link.springer.com/content/pdf/10.1007/s10203-018-0230-3.pdf

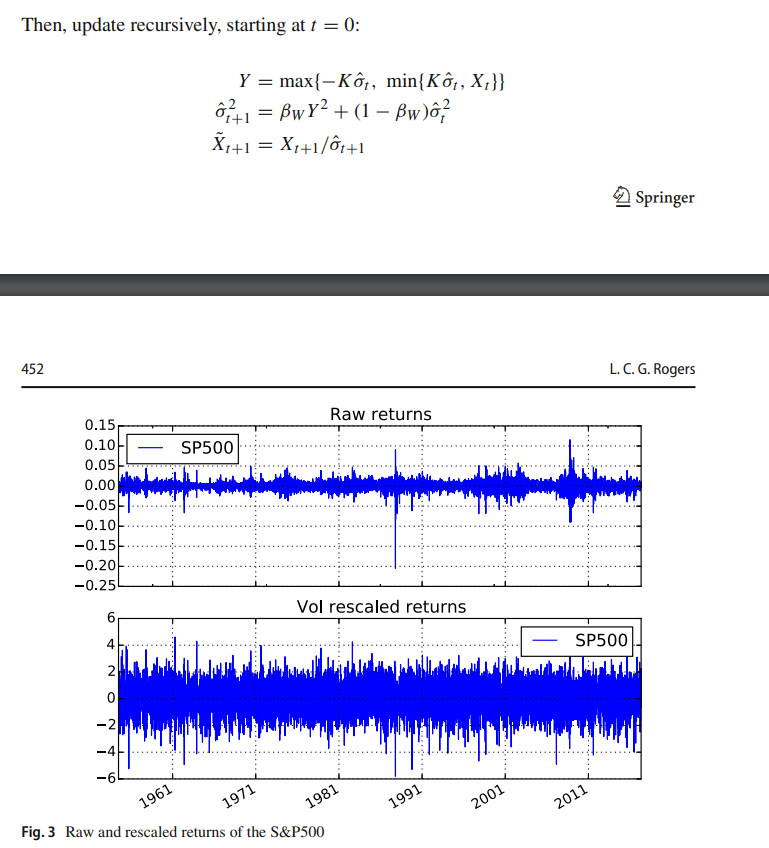
where the author rescaled the SP500 returns as follows:

enter image description here

enter image description here

As you can see, he managed to scale the returns on the extreme periods (for example Black Monday 1987) to look more like normal distributions.

I tried to replicate this method using Python using the same parameters as in the paper with K = 4, Beta is 0.025. N was not specified but I chose N to be 100. enter image description here

SP500['returns'] = np.log(SP500['Adj Close']/SP500['Adj Close'].shift(1))
SP500['returns_sq'] = np.square(SP500['returns'])
SP500.loc[:, 'vol'] = 0
SP500.loc[:,'Vol_rescaled_returns'] = 0
K = 4
Beta = 0.025
SP500.loc[101,'vol'] = np.sqrt(SP500.loc[1:101,'returns_sq'].mean())  

for i in range(101,len(SP500)-1):
  Y = max(-K*SP500.loc[i,'vol'],min(K*SP500.loc[i,'vol'],SP500.loc[i,'returns']))
  SP500.loc[i+1,'vol'] = np.sqrt(Beta*(Y**2) + (1-Beta)*(SP500.loc[i,'vol']**2))
  SP500.loc[i+1,'Vol_rescaled_returns'] = SP500.loc[i+1,'returns'] / SP500.loc[i+1,'vol']

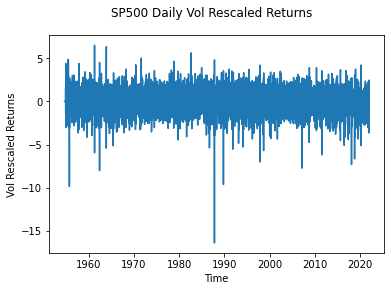
However, my result is different from the paper, as shown below with significant negative returns on Black Monday around -16 while on the paper it's -6. Is there anything wrong with my code above? I have checked a few times but it seems quite straightforward or is there a problem with this method? Thanks a lot! enter image description here
$\endgroup$
2
  • 1
    $\begingroup$ The non-normality has several causes, one of which is the fact that volatility changes over time. (It is known that a mixture of normal distributions with different $\sigma$ will NOT be normal). If you divide each day's return by the volatility measured over the previous 3 (or maybe 6) months, you will find that these "rescaled returns" are closer to being normal. But they are still not exactly normal. $\endgroup$
    – nbbo2
    Commented Dec 21, 2021 at 19:16
  • $\begingroup$ Hi, I managed to find a paper talking about vol rescaled returns and have tried to replicate that but did not manage to do that exactly. I have added the details to the original question. Could you please have a look? Thanks a lot! $\endgroup$ Commented Dec 21, 2021 at 21:33

3 Answers 3

4
$\begingroup$

Standardised log-returns are approximately normally distributed, $\frac{r_t}{\sqrt{\text{RV}_t}}\sim N(0,1)$.

As @noob2 says, heteroscedasticity is a big reason why (log) returns aren't normally distributed. If you correct for this fact (divide by the square root of realised variance, the sum of squared returns), then returns look quite close to being normal. Instead of realised variance, you could even use a simple GARCH model if you don’t want to use high frequency data.

To see some empirical evidence, check out these two papers:

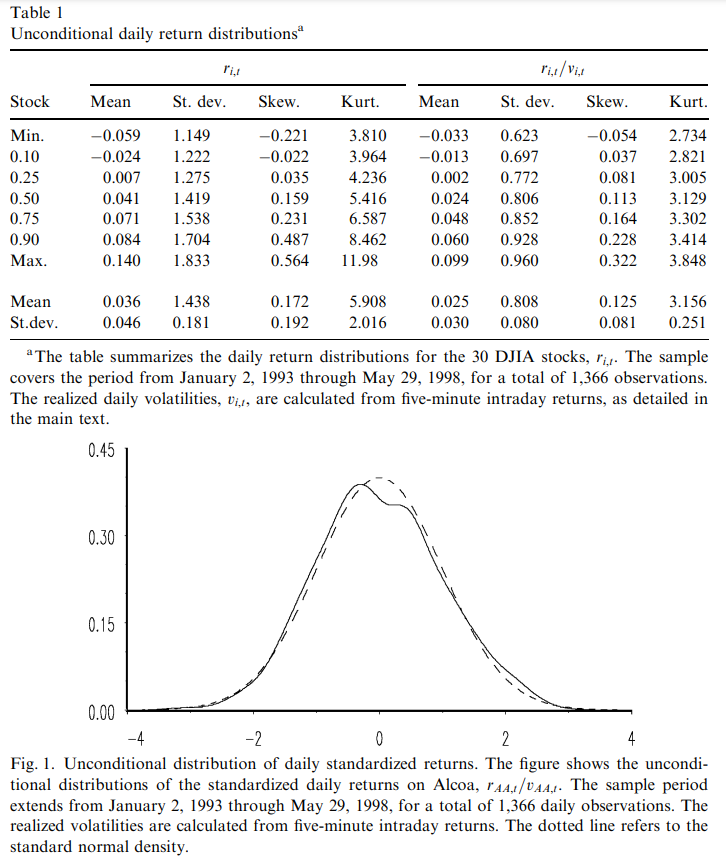
From the JFE paper: You see that $r_t$ has fat tails (kurtosis about 5). After scaling by realised variance, $r_t/v_t$, the kurtosis is much closer to the three of a normal distribution. You can see the resemblance to the normal distribution from the plot below. enter image description here

$\endgroup$
3
  • $\begingroup$ I think it is a stylized fact that standardized innovations in GARCH models of daily financial returns have tails heavier than normal. (In case of monthly or yearly returns, however, normality may be an OK approximation.) Given your references, I wonder how widely accepted normality of standardized innovations might be. $\endgroup$ Commented Dec 29, 2021 at 7:14
  • $\begingroup$ @RichardHardy The fit of a GARCH model improves if you allow for leverage (eg EGARCH) or take a better distribution for innovations (eg $t$ rather than normal). These are probably the two simplest tweaks that may improve the fit of a GARCH model. So yes, a vanilla GARCH(1,1) isn’t perfect, but it can be improved $\endgroup$
    – Kevin
    Commented Dec 29, 2021 at 10:36
  • $\begingroup$ I am addressing your opening statement. The fact that the Student-$t$ distribution is a better fit for standardized innovations than the normal distribution tells us that a normal approximation for standardized returns is crude (as there is a straightforward alternative – Student $t$ – that is better). We can discuss how crude and how much that matters, though. On the other hand, the operation of standardizing does bring returns closer to normality, and this is directly relevant to the original question. (We probably agree on facts but I wanted to make a comment about your formulation.) $\endgroup$ Commented Dec 29, 2021 at 15:32
2
$\begingroup$

There are several distributions that generalize normal distribution with skewness and kurtosis, and some of them are known to model the stock return better than a normal distribution.

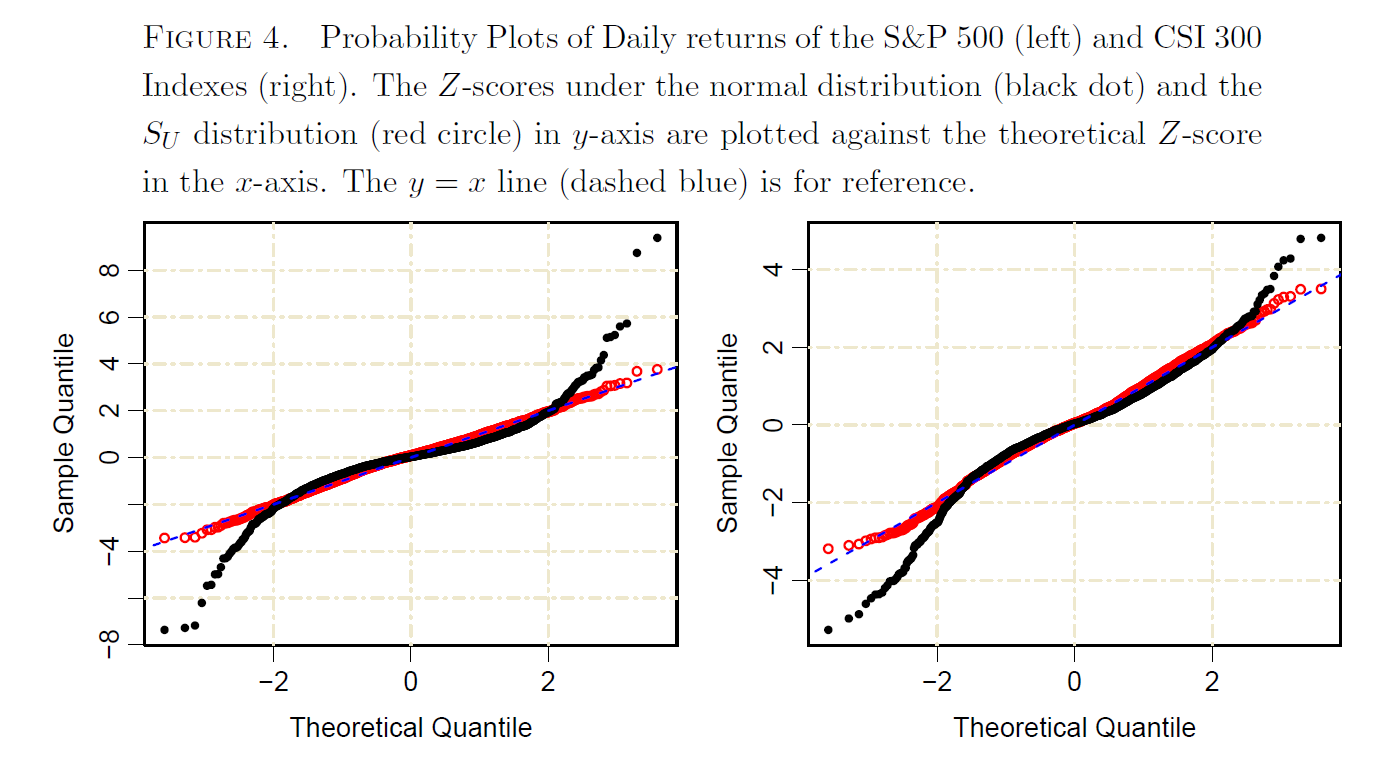
For example, Johnson's SU distribution is a good candidate. See the QQ plot (Figure 4) in Choi et al. (2019). Basically, the SU distribution is the sinh transformation of the normal variate. So, the arcsinh transformation (or rescale as you put it) of the stock return very closely follows a normal distribution.

Figure 4

Reference:

  • Choi, J., Liu, C., & Seo, B. K. (2019). Hyperbolic normal stochastic volatility model. Journal of Futures Markets, 39(2), 186–204. https://doi.org/10.1002/fut.21967
$\endgroup$
2
  • $\begingroup$ Interesting. I have found a free version of your paper arxiv.org/pdf/1809.04035.pdf and now I just have to read it. $\endgroup$
    – nbbo2
    Commented Dec 23, 2021 at 17:27
  • $\begingroup$ @noob2, indeed that's the preprint of the paper. $\endgroup$ Commented Dec 23, 2021 at 17:31
1
$\begingroup$

It is important to understand what causes non-normality. Consistent with noob2's comment, it could be attributed to a change in regimes. These regimes cause excess skewness and kurtosis, two properties that are inconsistent with normality. In this regard, one can impose a structural model on the data generating function. One potential is a combination of elliptical and non-elliptical components. Under this specification, one can perform a decomposition that filters the elliptical component from the returns. It all depends on the application. For instance, this paper illustrates this decomposition for portfolio selection.

$\endgroup$

Your Answer

By clicking “Post Your Answer”, you agree to our terms of service and acknowledge you have read our privacy policy.

Not the answer you're looking for? Browse other questions tagged or ask your own question.