EDIT
This is not a duplicate of my original question linked, since I have since overcome that problem and have posted an answer. Since solving the previous problem, I have run into the problem outlined here
I am attempting to perform a rolling forecast of the volatility of a given stock 30 days into the future (i.e. forecast time t+1, then use this forecast when forecasting t+2, and so on...)
I am doing so using R's rugarch package, which I have implemented in Python using the rpy2 package. (I find the Python package poorly documented and more difficult to use. Most of these packages are alo far more mature in R).
Here is my code so far, where the model is fit to the whole time series of the stock's returns up to the final 30 days of data I have. I then perform (I think) a rolling forecast for the final 30 days of the unseen data I have.
import numpy as np
import pandas as pd
import matplotlib.pyplot as plt

from rpy2.robjects.packages import importr
import rpy2.robjects as robjects
from rpy2.robjects import numpy2ri

ticker = 'AAPL'
forecast_horizon = 30

prices = utils.dw.get(filename=ticker, source='iex', iex_range='5y')
df = prices[['date', 'close']]

df['daily_returns'] = np.log(df['close']).diff()            # Daily log returns
df['monthly_std'] = df['daily_returns'].rolling(21).std()   # Standard deviation across trading month
df['annual_vol'] = df['monthly_std'] * np.sqrt(252)         # Convert monthly standard devation to annualized volatility
df = df.dropna().reset_index(drop=True)

# Initialize R GARCH model
rugarch = importr('rugarch')
garch_spec = rugarch.ugarchspec(
    mean_model=robjects.r('list(armaOrder = c(0,0))'),
    variance_model=robjects.r('list(garchOrder=c(1,1))'),
    distribution_model='std'
)

# Used to convert training set to R list for model input
numpy2ri.activate()

# Train R GARCH model on returns as %
garch_fitted = rugarch.ugarchfit(
    spec=garch_spec,
    data=df['daily_returns'].values * 100,
    out_sample=forecast_horizon
)

numpy2ri.deactivate()

# Model's fitted standard deviation values
# Revert previous multiplication by 100
# Convert to annualized volatility
fitted = 0.01 * np.sqrt(252) * np.array(garch_fitted.slots['fit'].rx2('sigma')).flatten()

# Forecast using R GACRH model
garch_forecast = rugarch.ugarchforecast(
    garch_fitted,
    n_ahead=1,
    n_roll=forecast_horizon - 1
)

# Model's forecasted standard deviation values
# Revert previous multiplication by 100
# Convert to annualized volatility
forecast = 0.01 * np.sqrt(252) * np.array(garch_forecast.slots['forecast'].rx2('sigmaFor')).flatten()

volatility = pd.DataFrame({
    'actual': df['annual_vol'].values,
    'model': np.append(fitted, forecast),
})

plt.plot(volatility['actual'][:-forecast_horizon], label='Train')
plt.plot(volatility['actual'][-forecast_horizon - 1:], label='Test')
plt.plot(volatility['model'][:-forecast_horizon], label='Fitted')
plt.plot(volatility['model'][-forecast_horizon - 1:], label='Forecasted')
plt.legend()
plt.show()
This code uses my own API to retrieve the daily prices, but this can be changed to your own price data to run the code.
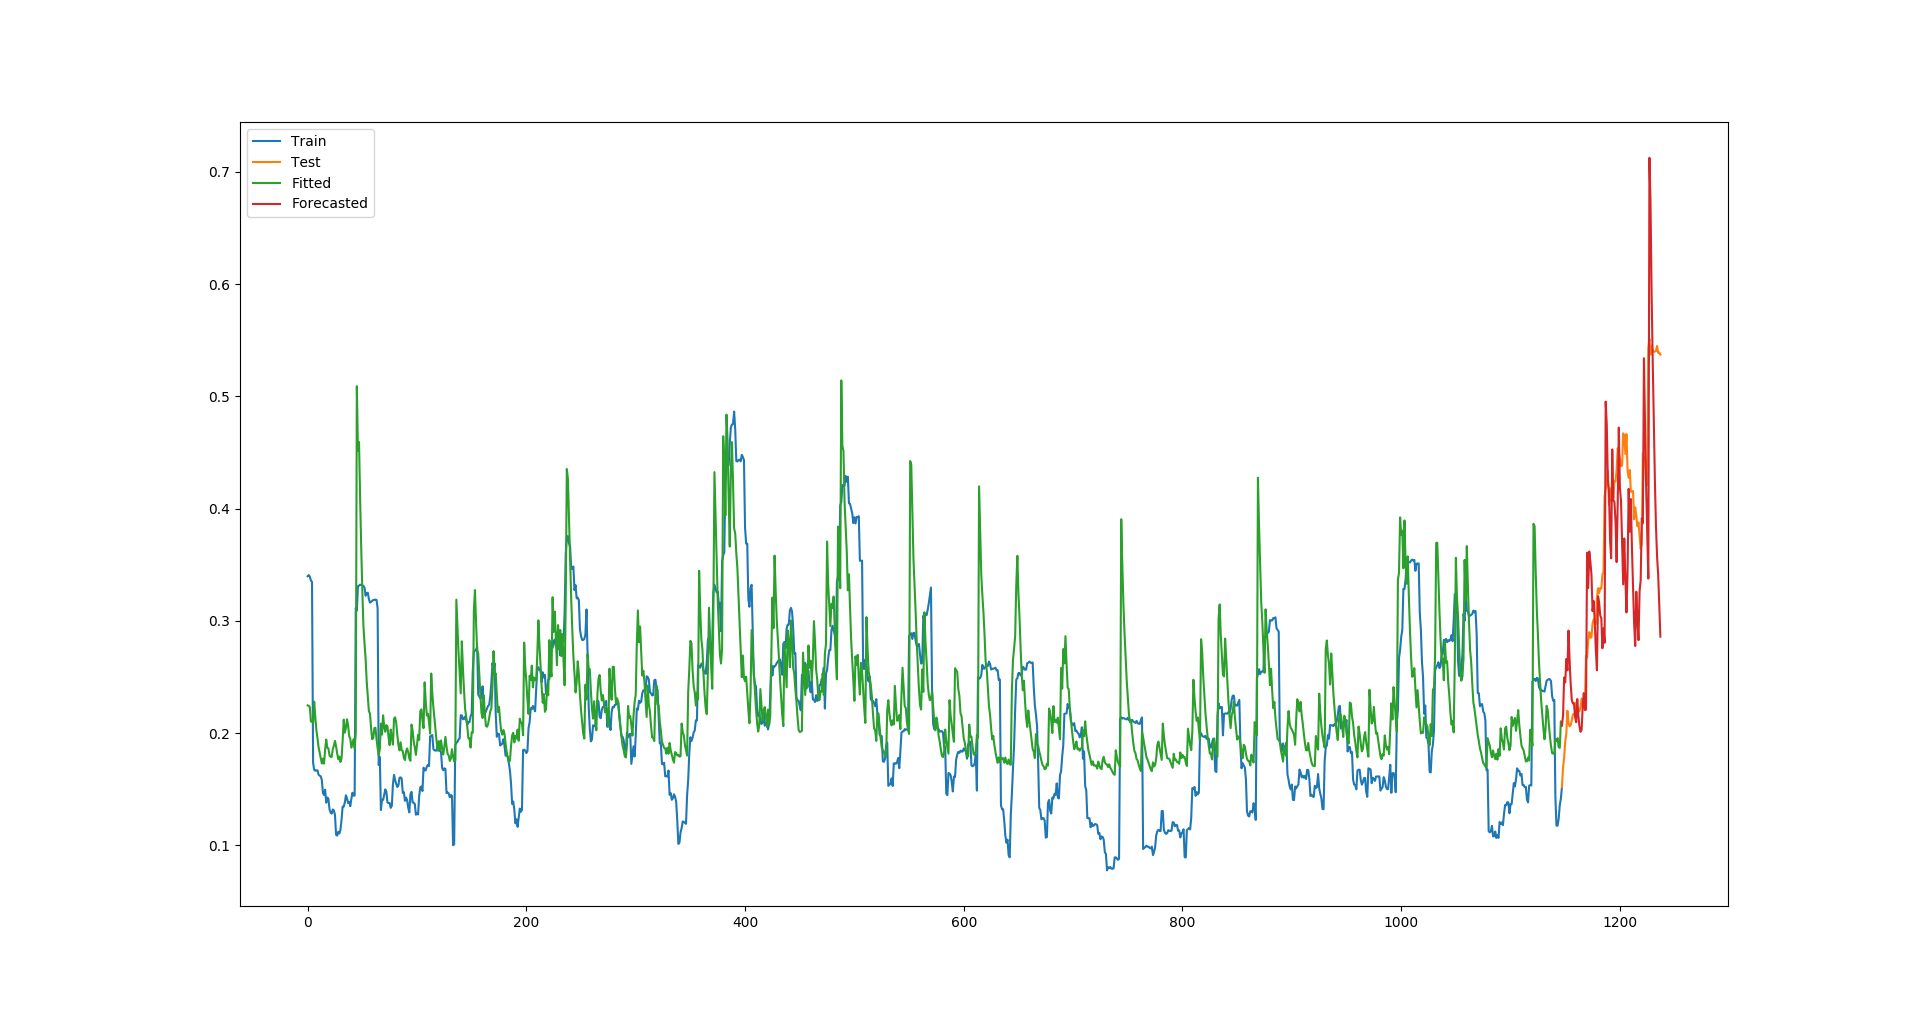
For AAPL, this script results in the following plot of actual vs fitted/forecasted volatility:
This leads to the following 2 questions:
This forecast on unseen data seems suspisciously impressive, especially given that Apple's recent volatility was so high in the test set - higher than anything the model was fitted to. Is this rolling forecast working the way I am expecting to? Or is the model actually seeing these final 30 days during fitting somehow?
If this rolling forecast is working as I expect, how can I now fit the model to the entire time series of training data I have up to today, and then perform a rolling forecast 30 days into the future? I cannot find anything in the documentation or any examples online that does this. No matter how good the model is on this test of historical data I have performed, it is completely useless if it can't be use to make actual forecasts into the future.


n.rolldoes not actually generate forecast into the future (as in dates after your latest observation was recorded).out.sampledictates the number of existing observations to be kept apart when we fit the model. Then.rollif specified, then would generate forecasts for these reserved observations, allowing you to compare the fitted value and forecast. To actually peek into the "future", we don't specifyn.roll; rather, we usen.aheadandn.sim. They don't rely on previous data but the unconditional means of the model. $\endgroup$rugarchauthor's example on therealGARCHmodel, a google search would take you there. $\endgroup$