1
$\begingroup$

Going through the literature on factor models, I keep seeing the phrase "dimensionality reduction" and how factor models allow for the modelling of assets in high-dimensional cases, and I would highly appreciate some explanation on how this works.

High dimensionality seems to occur when we attempt to model an entire asset universe (>1000, or $K$, assets, let's say) for optimal investment allocation, but there does not exist enough time-series data of $N$ data points for each asset, and standard techniques stop working when $N < K$. This is a clear issue.

Now, factor models try to explain an individual asset's return over time, $R_t$, with $k$ common factors $X_{k,t}$, through the basic model $$R_t = \beta_0 + \beta_1X_{1,t} + \beta_2X_{2,t} + \ldots + \beta_kX_{k,t} + \epsilon_t$$

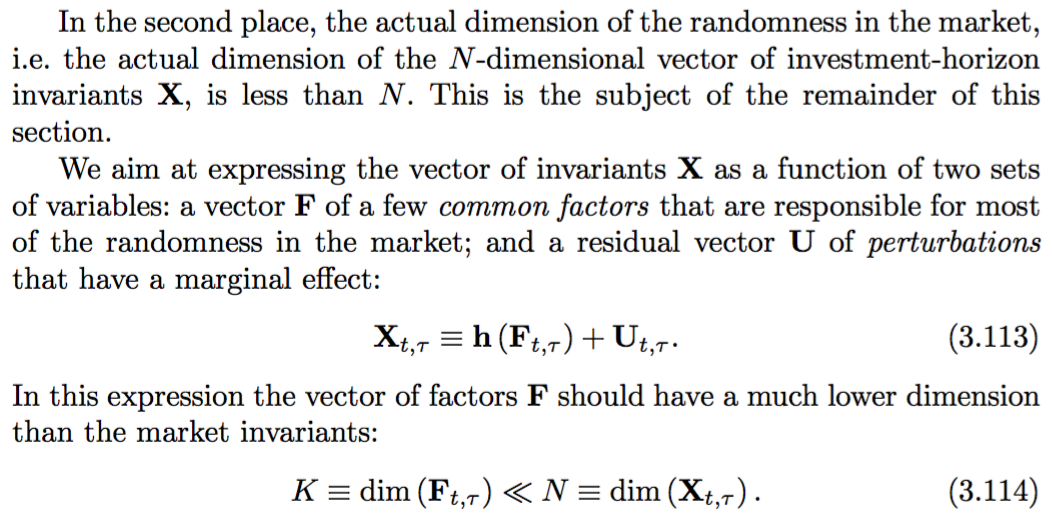
Succinctly put, how does such a model elaboration of $R_t$'s behavior reduce the dimensionality of the problem? There are still $K$ assets to model. Meucci's Risk and Asset Allocation (2005) describes it like this on pg. 132, without a satisfactory explanation (with $X$ being the returns and $F$ being the factors) ,

enter image description here

I hope someone can give the insight that explains this.

EDIT:

Could someone take me step by step through this imaginary example?

We have

  1. $K=20$ stocks,
  2. $N=10$ weekly price points for each (so a $N\times K$ matrix)
  3. $X=5$ factors shared among the 20 stocks (also 10 data points each)

Since the covariance of all the stocks cannot be calculated normally (since $N<K$), mathematically how does factor modelling recreate the covariance matrix?

$\endgroup$
2
  • $\begingroup$ Let’s say you have camels, 3D creatures as we see it. But you can look at their shadow- which is 2D. $\endgroup$ Commented Jul 22, 2019 at 11:41
  • 1
    $\begingroup$ Strictly speaking I would say that the dimensionality of the original problem remains. But it is divided into one sub-problem which only adresses the behaviour of, and the exposure to, the common factors. The other sub-problem regarding the "residual vector U of perturbations" is not dealt with further than asserting that they have a "marginal effect". $\endgroup$
    – Mats Lind
    Commented Jul 22, 2019 at 12:05

3 Answers 3

1
$\begingroup$

Simply speaking, author means that dimensionality-reduction can be achieved through factor modelling is because you may need only few factors (equal or less than numbers of variables/stocks) which explain most of the variation in your covariance matrix of variables/stocks.

Simple example: Assume you have 3 quantitative subjects: math (M), chemistry (C) and physics (Ph), you don't want to measure person's knowledge for each subject, thus you can conduct factor analysis and reduce your dimension of 3 subjects into single e.g. factor of 'quantitative intelligence' (QI), where each subject is a linear combination of this factor, e.g. M = $\beta$ QI + $\epsilon$.

$\endgroup$
1
  • $\begingroup$ Ok, so I may be starting to get it, but I think I need a step-by-step walk through of how this happens. I've edited my question; could you look over my example? $\endgroup$
    – Coolio2654
    Commented Jul 22, 2019 at 20:36
0
$\begingroup$

I think you may be overthinking it. The final relation (3.114) is really the crux of it. In short, that individual assets are exposed to some set of factors (X < K) and can be modeled as such rather than being driven idiosyncratically. As an analog, it's similar to PCA being used to model FI returns, where we can say three factors explain 90%+ of variation, versus bonds being driven simply by idiosyncratic factors. This is obviously an easier way to model security returns assuming factors are exhaustive and markets are complete.

$\endgroup$
3
  • $\begingroup$ I thank you for your answer, I just can't help but be overthinking this ^^; . While the logic of what you just said makes perfect sense to me, I don't see how I could use it in practice, as in how I could get the co variances of each asset. $\endgroup$
    – Coolio2654
    Commented Jul 23, 2019 at 4:06
  • 1
    $\begingroup$ They're kind of different things. You could of course simply calculate them directly given the underlying asset returns. Alternatively, with factor returns, loadings for each for each security, and an assumption that the model is robust, you could calculate based on the factor returns and loadings as a stand-in. $\endgroup$
    – Chris
    Commented Jul 23, 2019 at 4:58
  • $\begingroup$ Yes, to reduce dimensionality the model makes assumptions about the perturbations. These are made in a way to make the correlation matrix only dependent of the factors. Again, the original problem still has its dimensions, but the new problem has a lower dimensionality thanks to assumptions regarding the perturbations. $\endgroup$
    – Mats Lind
    Commented Jul 23, 2019 at 5:26
0
$\begingroup$

Technically, say you have $K\gg X$ stocks and $X$ factors. Your (daily) returns can be written as $$dR=\frac{dS}{S}=\mu\,dt + F\,dW$$ where

  • $\mu$ is a $K\times 1$ vector of expected returns (it is not very important since it is deterministic and will play no role in the computation of the covariance)
  • $F$ is a $K\times X$ matrix of loadings of returns on stocks
  • $dW$ is the random part of the factors, we assume that they are independent (it is what you usually expect from factors, but if they are not, it is not a big issue: the covariance matrix of your factors will appear in my computation, but for the sake of simplicity, I take it equal to zero).

A straightforward writing of the covariance of $dR$ is

$$C:=\mathbb{E}\left((dR-\mu\,dt), (dR-\mu\,dt)^T\right)= \mathbb{E}\left(F\, (dW\,dW^T)\, F^T\right).$$

If your factors are correlated, their covariance is a $X\times X$ dimensional matrix $\Sigma_W:=\mathbb{E} (dW\,dW^T)$, hence $C=F\,\Sigma_W F^T$. For my simple example $\Sigma_W={\rm Id}$ and then

$$C=F\,\Sigma_W F^T=F\, F^T.$$

It means that if you know how to write the $K\times X$ matrix $F$, you can compute the covariance of a large number of stocks without involving $K^2$ computations (but you need 'only' $K\cdot X$ computations). To know how to compute $F$, have a look at this question: Covariance matrix and Cholesky decomposition.

$\endgroup$

Your Answer

By clicking “Post Your Answer”, you agree to our terms of service and acknowledge you have read our privacy policy.

Not the answer you're looking for? Browse other questions tagged or ask your own question.