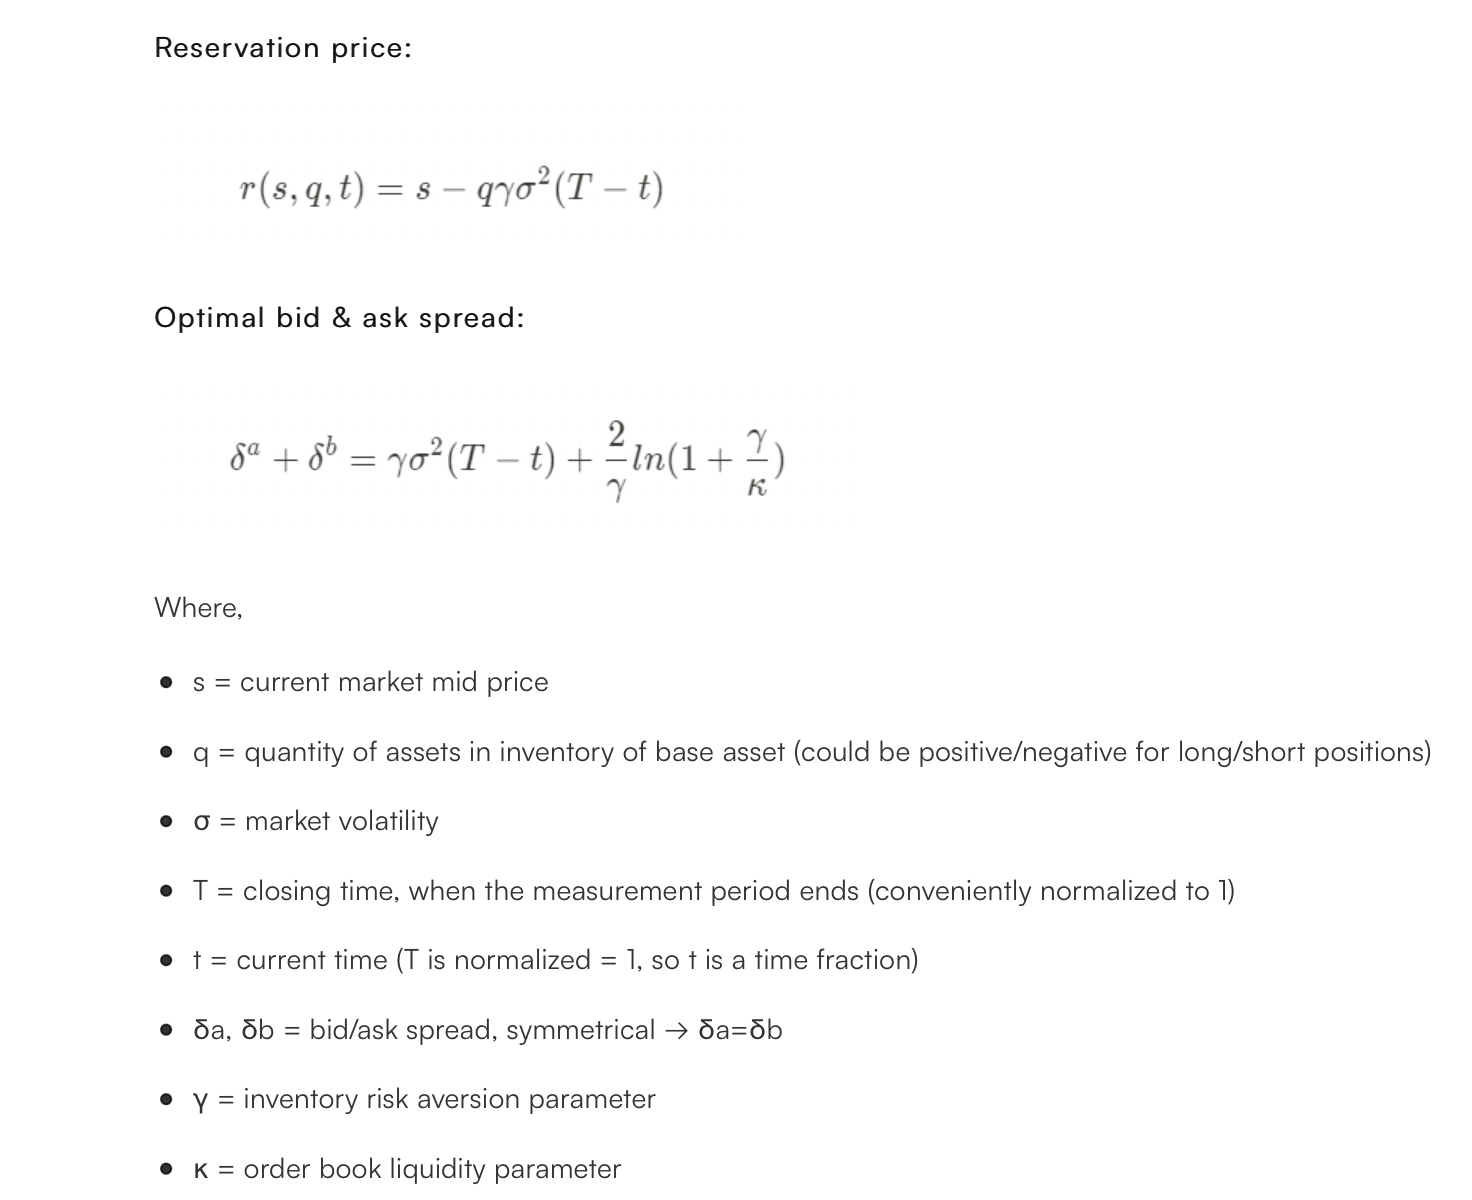
in our extension of Avellaneda - Stoikov paper, we provide some numerical examples: Dealing with the Inventory Risk. A solution to the market making problem.
In Faisabilité de l’apprentissage des paramètres d’un algorithme de trading sur des données réelles, Sophie Laruelle explains (in French) different ways to estimate the parameters on real data.
For this family of papers, you have parameters of different nature to estimate
- the (fair) price dynamics: essentially the volatility (and price movements if you have high frequency predictors)
- the liquidity dynamics: that are captured (in such models) by a "baseline intensity" $A$ and an "elasticity to the fair price" one $k$. The intensity of trades filling an order being at $\delta S$ to the fair price is $A\exp -k\,\delta S$. It means that the expectation of obtaining a fill during an infinitesimal time $dt$ is $A(\exp -k\,\delta S)\, dt$.
For the an estimation of the intraday volatility they are a lot of means (see for instance How to calculate historical intraday volatility?).
For the $(A,k)$ part, it is described in Sophie's paper and at Joaquin's thesis. The principle is the following:
- you want to capture the probability that an order at $\delta S$ of the fair price is filled
- you look in your history and you see an order that is at a distance $\delta S_k$ at time $t_k$ and you observe when it obtained an execution (say at $t_{k+1}$)
- you have your first data point: it took $\delta t_k:=t_{k+1}-t_{k}$ second to obtain a fill starting at $\delta S_k$, you collect as much as you can
- then you do some data curation (as usual) because you want to focus on "stationary situations" (or a least ergodic ones): remove outliers and inconsistant data (you can even create a "environment/context" indicator and condition by it). There is a matter of "censored data" too (if this order has been cancelled).
- the last step is the easiest: do the regression to obtain $(A,k)$ from your curated collection of $(\delta S_k, \delta t_k)_k$; you can do it simply using a log-linear regression, or minimize any loss function you like.

