2
$\begingroup$

What would be a good reference to understand how the interest rate (r) or dividend yield (q), and I guess the differential between the two, affect the implied volatility of the options?

If I look at a snapshot of a wide range of European Call (cash) prices on a US name, an approximate 2 month interest rate would be around 5.5%.

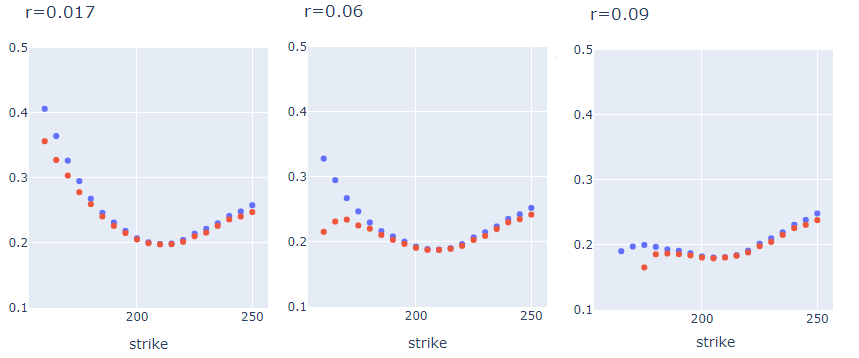
How can I determine what the correct rate or range or rates are based on option prices? You can see that a normal smile would be between the r = 0.017 and 0.06, but once r gets too high, the in-the-money calls have a weird volatility that makes the smile look wrong.

Is there a way to estimate the true r?

The same happens with the dividend yield for ITM put options, where the smile just drops off and looks wrong.

enter image description here

$\endgroup$
1
  • $\begingroup$ I'd argue that both, the interest rate and the dividend yield, have no first order effect on the option implied volatility. For companies with an interest rate dependent business model (e.g. real estate), though, we should see some interest rate dependence thru the valuation of balance sheet items and hence an (indirect) effect of the rates (volatility) on implied volatility. Alas, I have no empirical evidence at hand backing my claim; hence this is only a comment :-) $\endgroup$ Commented Jan 23 at 20:17

1 Answer 1

0
$\begingroup$

There's no way to know the exact relationship because there isn't an analytical solution for implied volatility. Intuitively, fromthe Black-Scholes equation: $$ \begin{aligned} C\left(S_t, t\right) & =N\left(d_{+}\right) S_t-N\left(d_{-}\right) K e^{-r(T-t)} \\ d_{+} & =\frac{1}{\sigma \sqrt{T-t}}\left[\ln \left(\frac{S_t}{K}\right)+\left(r+\frac{\sigma^2}{2}\right)(T-t)\right] \\ d_{-} & =d_{+}-\sigma \sqrt{T-t}, \end{aligned} $$

increasing $r$ increases the price of the option, which results in an decrease in implied volatility as we need to keep the value of the option the same (like balancing an equation). (Which is why we observe this in your figures).

I think what you’re actually asking is how to “back-out” the $r$ and $q$ - affectively trying to find the implied-forward rate?

If the option is of the European type, you can calculate the forward using put-call parity on a put and call option with the same strike and expiration:

$$C - P = Se^{-qt} - Ke^{-rt}$$

If the option doesn’t pay a dividend, then just rearrange the equation for $r$. Otherwise, you can estimate $r$ using the guaranteed treasury bond rate and then back-out the dividend rate. If you don’t have an estimate for $r$ or $q$, you can’t really estimate either from just the face-value of the option because there are infinitely many different solutions for $r$ or $q$ that satisfy the put-call parity equation.

But again, this is merely an estimation and completely theoretical. From personal experience, because of the bid-ask spread, you can sometimes get unreasonable results like negative interest rates, 25% dividend rates etc. That doesn’t mean put-call parity is wrong, it’s just that the bid-ask spread is too big to give a good estimate of most metrics anyway.

Recently, I was backing-out the forward on ASX options, trying to gauge Australian interest rates. Some illiquid equities were resulting in negative interest rates, which is ridiculous, especially in current times of high interest-rates.

$\endgroup$
3
  • $\begingroup$ To my knowledge, Shimko had the first (nice) article on backing out levels of the index and risk-free-rates given a set of observed option prices. Using this method, one finds quite stable levels of $q$ and $r$ through simple linear regression. researchgate.net/publication/306151578_Bounds_of_probability $\endgroup$ Commented Jan 23 at 20:19
  • $\begingroup$ I skimmed the paper, but that's affectively what I said but over multiple strikes and then performing regression, no? $\endgroup$ Commented Jan 24 at 3:59
  • $\begingroup$ Yes, it is. By using data across multiple strikes, we can reduce the estimation error and back out the discount factor and underlying (index) level at the same time with good good accuracy. $\endgroup$ Commented Jan 24 at 8:18

Your Answer

By clicking “Post Your Answer”, you agree to our terms of service and acknowledge you have read our privacy policy.

Not the answer you're looking for? Browse other questions tagged or ask your own question.