Questions:
- Is GDP disconnected from the stock market?
- What explains this?
GDP is the product of final goods and services in the entire domestic economy. That's includes all goverment spending, haircuts, street food, bread in your local bakery, beer at your loca pub and millions of other things that are not sold by listed companies. The same applies to prices. However, listed companies are generally the ones that are more productive and bigger than unlisted. The ones that enter into an index are the best ones out of these. They are also operating internationally, and a large part of their business never shows up in domestic income.
It's the big names that move an index like SPX, see for example CNBC. The article is based on 2021 data. For example, it explains that
- Apple and Microsoft appear in the top 5 companies in the S&P in nine out of the last 10 years.
- The top 5 companies (AAPL, MSFT, AMZN, TSLA, GOOGL) in 2020 and 2021 contributed 61% and 31% of the entire S&P500 return.
- Apple doubled its market capitalization from early June 2020 to its current $2.8 trillion, which is now about 6.8% of the index.
- Microsoft made a similar ascent in under two years: It’s now 6% of the S&P 500.
More reliable research like There are a few good research papers like Bessembinder also shows that the superior performance of the entire stock market is largely a result of the exceptional performance of a few stocks. For example,
the 90 top-performing companies, slightly more than 0.3% of the
companies that have listed common stock, collectively account for over
half of the shareholder wealth creation since 1929.
So far, we were mostly concerned with an upward trend, but the same applies in downward trends as well.
The stock market declined in 2022:
- S&P: -16.72%
- Apple: -20.81%
- Google: -32.57%
- Amazon:-44.78%
- Netflix: -51.1%
- Meta (Facebook): -64.20%
- Tesla: -65%
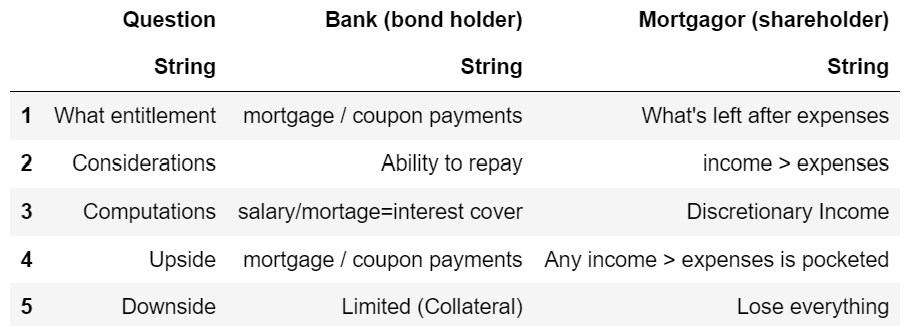
The bigger names are the ones that are frequently hit the most. A key point to understand this is that stocks only represent the ownership part. It's leveraged with debt and any excess return goes entirely to the owners (shareholders).
Why does equity fluctuate so much?:
Unfortunately, I could not find the example I have in mind. However, what will follow will be my own recollection of the topic. The example demonstrates the impact of debt and leverage on shareholder returns (and stock valuation) with a simple, more relatable example of a homeowner with a mortage. To demonstrate this, I built the following table in Julia.
using DataFrames, PrettyTables

salary  = [110000, 125000, 55000, 195000]
mortgage = [20000 for i in 1:4]
tax = [0.3* i for i in salary.-mortgage]
expenses = [16000 for i in 1:4]
discretionary_income = salary.-mortgage.-tax.-expenses
pct_I = [i*"%" for i in string.(round.(append!([0.0],[(salary[i]/salary[i-1]-1)*100 for i in 2:4]), digits = 1))]
pct_DI = [i*"%" for i in string.(round.(append!([0.0],[(discretionary_income[i]/discretionary_income[i-1]-1)*100 for i in 2:4]), digits = 1))]
df = DataFrame("Periods" => ["Year $(i)" for i in 1:4], "Income(I)" => salary
    , "Mortgage Paym." => mortgage
    , "Income Tax (30%)" => tax
    , "Net I" => salary.-mortgage.-tax
    , "Living exp." => expenses
    , "DI" => discretionary_income
    , "Pct Chg I" => pct_I
    , "Pct Chg DI" => pct_DI)

PrettyTables.pretty_table(df,  border_crayon = Crayons.crayon"blue"
    , header_crayon = Crayons.crayon"bold green"
    , formatters = ft_printf("%'d", [2,3,4,5,6,7,8])
    , highlighters = (hl_value("1152.9%" )))

It's probably quite straightforward, but here is a summary:
- We are looking at a 4 year period
- with fluctuating income (think of it as including bonus payments depending in profit)
- a fixed rate mortgage (similar to fixed rate bonds for financing machinery etc.)
- 30% income tax (payable on income - expenses / mortgage payments)
- Net income after tax
- Living expenses (overhead costs) that do not fluctuate with income (somewhat simplied).
- Disposable income (profit): what is left over after debt payments, taxes and expenses.
As you can see, any excess income goes directly into disposable income, which fluctuates wildly compared to gross income (the last two columns show the percent changes relative to the previous period). Translating this into listed companies is not that difficult. Just think of mortgagee (bank) beeing the bond holder, and the home owner being the shareholder:

Generally, equity valuations will be largely based on "discretionary income" considerations.
The Buffett Indicator:
Some people, most notably Warren Buffett use(d) the ratio of the $stocks / GDP$ as a valuation multiple to assess how expensive or cheap the aggregate stock market is at a given point in time. It is even coinded the Buffett Indicator now. Plenty of details can be found in here.
The interpretation of the ratio is similar to the Price-Sales Ratio which is usually total market capitalization (the number of outstanding shares multiplied by the share price) divided by the company's total sales.
$$P/S \ Ratio = \frac{Market\ Cap}{Sales}$$If the value is below 1, the investor is paying less for each unit of sales (or more if above 1).
On top of listed companies not being the entire economy (as shown above), there is at another major problem with this approach though. Globalization has expanded steadily over the years. While GDP does include national exports, it for example excludes sales Amazon makes in India from Indian sellers. On the other hand, all of Amazon's business activities will be part of its stock valuation. Likewise, while Apple sales are biggest in the US, it only accounts for roughly 40% of global sales.
To sum up:
- Stocks are very volatile by nature (discretionary income logic).
- Stock valuation takes into account all activities, also outside of the domestic economy.
- The stock market is forward looking, whereas GDP is a backward looking, lagging value that measures a lot of activities that do not belong to listed companies.


