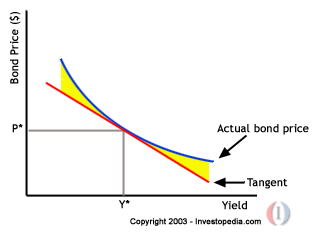
I cannot quite understood absolutely why a barbell portfolio has higher convexity than a bullet porfolio.
I can easily understand how the parallel line represents duration but I cannot see what the curve of the convexity would look like. My guess is that this curve would start very high and then decrease to zero. If so this would explain why a barbell portfolio has a higher convexity than a bullet portfolio purely due to buying the very high yielding bond. I am also not sure whether this solution would be stable as the original bond price-yield curve may move causing changes in the mathematical derivatives.
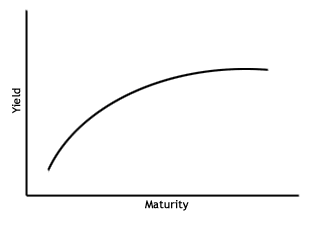
Moreover I cannot see how convexity could be pictured using the yield curve, ie on the graph below, which I believe may be key to fully understanding convexity.
Please assume normal market conditions and "normal" bond curves, ie positive convexity (at least primarily).


