10
$\begingroup$

I am struggling to find a general theory of position sizing. Help!

The literature is all about fractional position sizing, but that's just one of the innumerable strategies. What about all the other sizing strategies?

The problem:

  • Suppose I have a daily trading strategy that generates a daily return $r_i \sim N[\mu,\sigma^2]$
  • I start with capital $x_0$ and run my strategy once a day, for 1 year
  • each day I begin with the previous day's capital $x_{i-1}$ and I risk an amount $y_i=f(x_{i-1})$
  • at the end of the year, I end up with a capital $x_n \ge 0$

Let's look at common metrics:

  • $R=(x_n-x_0)/x_0$ the yearly return on investment
  • $\mu_R=E[R] =$ the yearly return expectation
  • $\sigma_R^2=\text{VAR}[R] =$ the yearly return variance
  • $Ϛ_R=\frac {\mu_R} {\sigma_R} = $ the Sharpe Ratio

Questions:

  • what utility function $U(R)$ would a risk-averse investor optimise?
  • what is the best trade sizing function $f(x_i)$ that optimises $U(R)$ ?

An example:

  • let's pick the Sharpe Ratio as utility function, so $U(R)=Ϛ_R$
  • let's explore how different trade sizing functions yield different utility

enter image description here

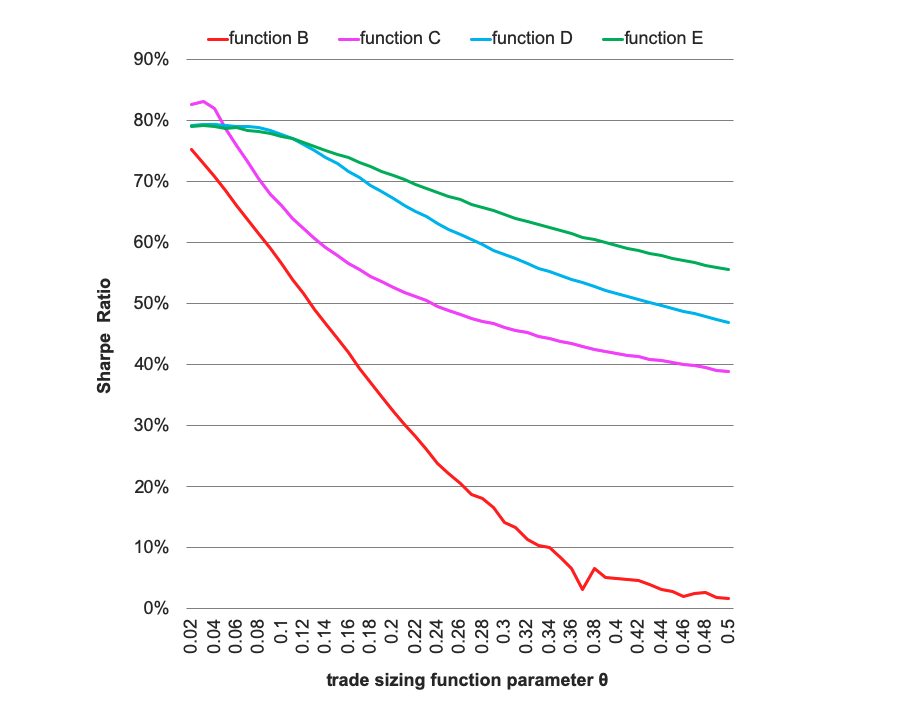
  • so function "B" in the chart corresponds to fractional trade sizing, while function "D" corresponds to constant trade sizing. The others two functions are less common, I picked them arbitrarily.

  • besides being different functions, each function has a tuning parameter $\theta$. As an example, for function "B", $\theta$ is the % of my current capital I risk at each trade. That is $y_i=f(x_{i-1})=\theta x_{i-1}$

  • I simulated 1M runs of each trade sizing function, also varying the tuning parameter $\theta$ between $0$ and $1$

  • the various trade sizing functions yield a very different Sharpe Ratio, and -somewhat surprisingly- fractional trade sizing is the worst! (see red curve below)

  • in the chart below are the results for daily return $\mu=1, \sigma=20$. But the differences in performance remain similar when I change $\mu$ and $\sigma$.

enter image description here

More questions:

  • why is everyone talking about fractional trade sizing, if it shows such a bad Sharpe Ratio?

  • did anyone study the problem more generally, instead of just trying arbitrary trade sizing functions, like I did in my empirical study?

Your opinion is welcome, thank you!

$\endgroup$
2
  • 1
    $\begingroup$ Your parameter $\theta$ means something different for each of your four trade sizing functions, so I'm not sure that your last chart is very meaningful. That said, I'm not surprised that it shows the behaviour that it does, since risking large fractions of your initial capital is known to be a bad strategy when your edge is small, and your 'fractional trade sizing' strategy is the only one that continues to increase the trade size with $\theta$. To say something more sensible, we would need to know the parameters $\mu$ and $\sigma$ that you used in your simulation. $\endgroup$ Commented Jan 9, 2020 at 14:52
  • $\begingroup$ thanks @ChrisTaylor, you are correct about $\theta$, but consider that the fractional sizing strategy (red curve) is below the other curves for all $\theta$ no matter what $\theta$ specifically means for each sizing strategy. The charts are with μ=1, σ=20 but I got similar curves for σ=10. I could try many other σ, but as said I'm looking for a general theory, rather than piling up empirical results 🙂 $\endgroup$
    – elemolotiv
    Commented Jan 9, 2020 at 17:33

1 Answer 1

2
$\begingroup$

I've recently had to do quite a bit of work on position sizing.

Leonard C MacLean, Edward O Thorp, and William T Ziemba have written an incredible amount of literature on this. The following text book encompasses an incredibly deep study of the topic on position sizing, different utility functions and so on.

From what I can tell the two broad branches of position sizing split into capital growth theory and variants of mean-variance. In the context of Kelly, the Sharpe ratio may not be the best metric since it is trying to maximize growth rather than stable growth as measured by the Sharpe ratio.

Much of this is highlighted in the book above. I think you will find it a noteworthy read.

It has been shown that if you know the probability of success and the payout then there exists no other algorithm that outperforms the Kelly criterion over an infinitely long horizon (in terms of maximizing growth, not Sharpe). Much of the problem is that we, of course, don't have the probability of success upfront and often what this results in is us moving from Kelly in a two outcomes discrete setting to Kelly in continuous time which can be also be used in a portfolio management setting.

For games such as 21 Black Jack where we can determine the payout and probability of success, Kelly works fantastically well and has been coined Fortunes Formula.

$\endgroup$
4
  • $\begingroup$ thanks Jacques! I will check the book (despite the title of the book says almost the opposite of the title of my Question 😅) -- In general, what surprises me is that, while the Sharpe Ratio is one of the most used performance metrics in the industry, no one has thoroughly studied money management to maximise the Sharpe Ratio. – $\endgroup$
    – elemolotiv
    Commented Jan 18, 2020 at 14:03
  • 1
    $\begingroup$ @elemolotiv, Haha yea I realise the title isn't what you were looking for but there is a good section that covers the various utility functions, why they chose the log of wealth utility. Mean-variance portfolio optimization is in line with maximizing Sharpe Ratio but this is of course on a portfolio level and not on an individual asset. I haven't specifically seen a strategy that tries to maximize Sharpe on a single asset. It would be hard since you can't make use of other assets to reduce your variance but maintain the same expected returns. $\endgroup$ Commented Jan 19, 2020 at 19:04
  • $\begingroup$ Jacques, I see a big difference between Money Management and Portfolio Optimisation. With money management you start with an initial capital ($x_0$ in my Question), you trade every day through the year and if your capital regrettably goes down to zero, you must stop trading - you are out! With portfolio optimisation you don't have such a constraint. You assume you have infinite capital, so you will always reach the end of the year. Your focus is to optimise the mean/variance that you will get at the end of the year. So I believe the two techniques address different problems. $\endgroup$
    – elemolotiv
    Commented Jan 20, 2020 at 22:05
  • $\begingroup$ @elemolotiv, I disagree. If you follow Kelly criterion to its natural conclusion then you land up with Kelly in continuous time and the other set of optimal growth portfolios such as universal portfolios and online portfolio selection. Both of these field you mentioned here stem from the idea of how to allocate capital in an optimal way. Portfolio optimisation certainly doesn't assume you have infinite capital, if it did then we wouldn't be able to use it in practice. Mean variance is about maximising Sharpe ratio by using multiple assets. Kelly is about maximising wealth. $\endgroup$ Commented Jan 22, 2020 at 9:38

Your Answer

By clicking “Post Your Answer”, you agree to our terms of service and acknowledge you have read our privacy policy.

Not the answer you're looking for? Browse other questions tagged or ask your own question.