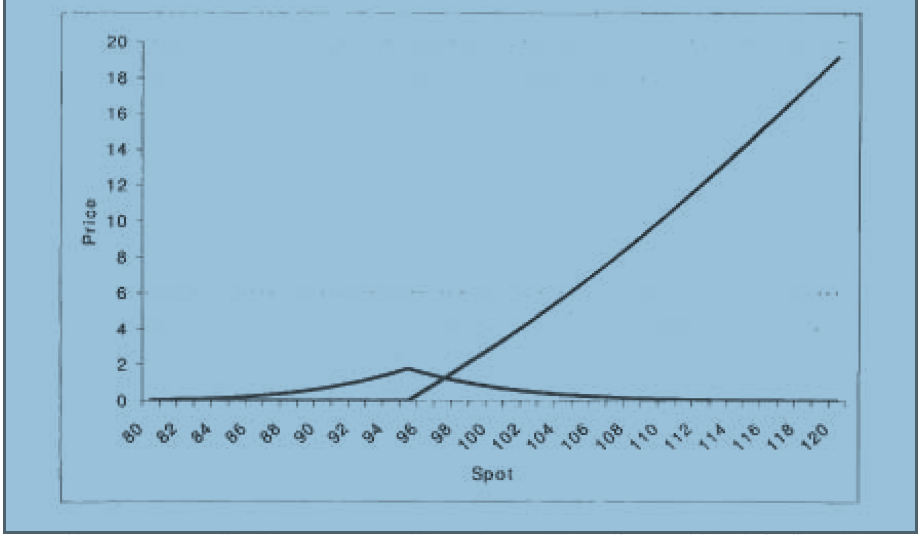
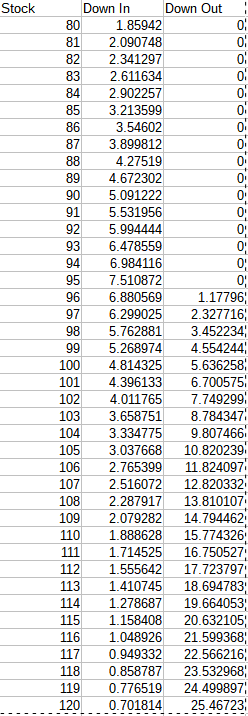
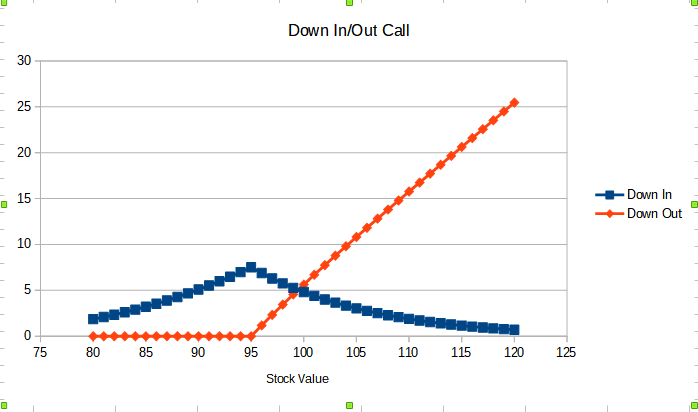
Here is a graph of Price vs Spot from Joshi's Quant Interviews book,
The first line is a down-and-out barrier option and the other one is a down-and-in barrier option. The strike is 100 and the barrier is at 95.
Why does the down-and-in option look like a hump? I would have thought there would be someone asymmetry due to the barrier causing the option to spring into life.


