11
$\begingroup$

Usimg the put-call parity

$C - P = S - K · e^{-rt}$

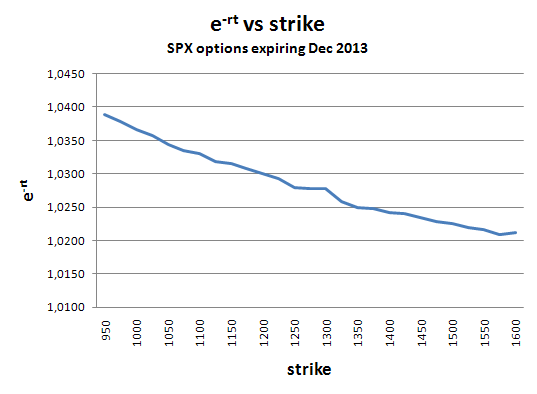
I tried to estimate the value of $e^{-rt}$, the present value of a zero-coupon bond that matures to 1 in time $t$:

$e^{-rt} = (P - C + S) / K$

Where $C$ and $P$ are call and put prices, respectively, calculated as the average between bid and ask prices; $S$ is the price of the underlying and $K$ is the strike price.

I tried this with the SPX options with expiration Dec 2013.

decreasing e-rt

I expected to get a constant $e^{-rt}$, but I got a decreasing $e^{-rt}$ instead. Why is this?

Edit: The spreadsheet that generated the chart

$\endgroup$
6
  • $\begingroup$ I think it has to do with incorporating dividends into put-call parity. Note that $e^{-rt}$ is positive here, which would imply negative interest rates. The rates are more negative for a lower price. Not 100%, but it is like the dividend yield is higher for a lower stock price. $\endgroup$
    – John
    Commented Oct 5, 2012 at 15:37
  • $\begingroup$ @John Dividends have nothing to do with strike price. $\endgroup$
    – justin--
    Commented Oct 16, 2012 at 18:26
  • $\begingroup$ @Justin I didn't say they had anything to do with the strike price. I said I thought it had to do with incorporating dividends into put-call parity, as even your answer addresses. $\endgroup$
    – John
    Commented Oct 16, 2012 at 21:26
  • $\begingroup$ @John it still doesn't matter whether or not the dividend yield is higher for a lower stock price. $\endgroup$
    – justin--
    Commented Oct 17, 2012 at 0:10
  • $\begingroup$ @justin I see what you're saying, but I'm not sure that's what I meant. I believe (been a while) I was arguing that the implied dividend yield in the market, working backwards, would be larger for the smaller strike price. Again, similar to your much better thought out answer where you provide the formula. Some cursory double-checking of his graph and the formula you provide suggests that the implied dividend would be higher for the lower stock price strikes. $\endgroup$
    – John
    Commented Oct 17, 2012 at 4:20

4 Answers 4

10
$\begingroup$

To answer a question with a question - are you assuming proportional or constant dividends? :)

The general consensus of the market is that dividends are somewhere between proportional (fixed yield) and constant (fixed dollar). The carry embedded into the forward prices at different strikes reflects that consensus, in fact you can establish the "constantness" of the dividends based on the slope of the curve (and you will see that it's mostly constant).

Mathematically, you should think of it this way. In a fixed yield dividend model, you have $F_t = S_0e^{t(r-y)}$ where $y$ is your dividend yield. Conversely, for a fixed dollar dividend model, your you have $F_t = S_0e^{tr} - D$ where $D$ is your constant dollar dividend. If you assume the second is true in the market, inverting the first one will give you different dividend yields for different levels of forwards, with dividend yield decreasing as your forward strike is increasing.

$\endgroup$
1
  • $\begingroup$ Thanks Strange. I was not considering dividends at all. $\endgroup$
    – Victor
    Commented Oct 5, 2012 at 23:48
7
$\begingroup$

Dividends are the key.

For simplicity, let's include a single dividend at the time of expiration, and assume that the options are European and expire ex. (There is really no reason not to assume that an option on a market index is European. EDIT: not quite true; that's discussed here.)

$S+P = e^{-rt}K+C + e^{-rt}D$

This is a certain fixed dividend, but that is not material to our purposes. Whether or not the dividend is subject to market risk and to what degree, or whether or not the dividend is correlated with a change in price of the underlying, it doesn't matter, because in any event, the present value of dividend(s), or what the market expects it to be, has absolutely nothing to do with the strike price of an option.

All is not lost:

$e^{-rt} = \dfrac{S+P-C}{K+D}$

Take your spreadsheet, and solve for a fixed $D$ that makes that line flat. Then you will have $e^{-rt}<1$ as expected, and $e^{-rt}D$ is the present value the market places on underlying dividends from now to expiration.

EDIT #2 alternate way to work this out:

$S+P_1 = e^{-rt}K_1+C_1 + e^{-rt}D; \\ S+P_2 = e^{-rt}K_2+C_2 + e^{-rt}D.$

Subtract the first equation from the second:

$P_2-P_1 = e^{-rt}(K_2-K_1) + C_2 - C_1.$

Rearranging terms

$C_1-C_2+P_2-P_1 = e^{-rt}(K_2-K_1)$

we have created a synthetic bond from options at two different strikes which has an unambiguous interest rate because the value of any underlying dividends has cancelled out.
$\endgroup$
4
  • $\begingroup$ You do realize that it's going to be a different D for every strike (just by nature of dividends being somewhat undefined)? In general, for market-making in longer-dated options, there is no way around making a dividend process assumption. For most things you'd do as a non-MM, your sensitivity to the dividend assumptions is going to be fairly low anyway. $\endgroup$
    – Strange
    Commented Oct 18, 2012 at 22:33
  • $\begingroup$ No. $\frac D {strike}$ is different for every strike, not $D$ itself. Whatever the market expects dividends to be, that's what they're expected to be, regardless of options. $\endgroup$
    – justin--
    Commented Oct 19, 2012 at 2:24
  • $\begingroup$ You are making an assumption of constant dividends, which, for longer-dated expiries is wrong. E.g. when you trade a dividend swap, do you assume zero underlying delta? As I said before, the markets "convention" is somewhere between constant and proportional dividends. It is even more complicated because of the dividend growth assumptions past the announced dividends. You can easily prove it to yourself - go to your bloomberg, download the Dec14 strip and calculate forward prices from put/call parity. You would be unpleasantly surprised. $\endgroup$
    – Strange
    Commented Oct 19, 2012 at 4:32
  • $\begingroup$ Well here's an exercise for you @Strange one. Buy a call 1000 and sell a covered call 1500. Then buy a put 1500 and sell a secured put 1000. What did that all just cost you net, and what's it going to be worth come expiration time? Can you figure out the interest rate from that? $\endgroup$
    – justin--
    Commented Oct 20, 2012 at 4:49
1
$\begingroup$

In the Put-Call parity you assume that a risk-free rate $r$ exists, but that's not the case in reality; there is no using risk-free rate. But I can't tell you why it's decreasing, but it's not surprising that it's not constant.

What's more surprising though, is that $e^{-rt}>1$ is should be smaller. Could you plot $r$ only?

$\endgroup$
1
$\begingroup$

In the Put-Call parity r is assumed to be risk-free interest rate.

In reality, the interest rate the is rate at which interest is paid by a borrower for the use of money that they borrow from a lender. Its behavior is similar to price in the market , which price fluctuation depends on the news in the market. It is usually higher than risk-free interest rate. because of the consideration of inflation mainly controlled by money supply and risk-premium that the lenders may not receive the money returned from the borrowers.

$\endgroup$

Your Answer

By clicking “Post Your Answer”, you agree to our terms of service and acknowledge you have read our privacy policy.

Not the answer you're looking for? Browse other questions tagged or ask your own question.