4
$\begingroup$

Here's a question that's been on my mind on-and-off for some time now.

It's well known that Black-Scholes is an unsuitable model for pricing in the current (post 80s) market as it fails to capture the volatility smile/skew. A crude way around this is to calibrate a volatility surface by finding the volatility for which the market price agrees with the theoretical B-S price for a given set of strikes and maturities. Armed with this, we can price options which are consistent with the market. A better way is to use local or stochastic volatility models.

However, what I don't understand is that in each of these models, particularly B-S and local vol models, volatility is related to the underlying, not the option itself. As such, implied volatility seems to be making a statement about the forward-looking volatility, not of the option, but the underlying. In the Black-Scholes setting, we use a log-normal diffusion $$\mathrm{d}S_t = r_t S_t\mathrm{d}t + \sigma S_t \mathrm{d}W_t$$

and in a local volatility model we might amend this with a (deterministic) function $\sigma$ such that $$\mathrm{d}S_t = r_t S_t\mathrm{d}t + \sigma(t, S_t) S_t \mathrm{d}W_t$$

Now here comes my confusion. I can easily see how the time to expiry of an option might make a difference in the volatility the underlying exhibits over that time period. During a particularly turbulent time in the market we are perhaps expecting that the underlying might experience more volatility in the short term than in the long term, which could be reflected in option prices.

However I'm less convinced why the strike price should matter. Why should the strike price, which is inherently linked to the option, and the option alone, make any kind of statement about the volatility of the underlying? The closest intuition I can get is that the strike makes some sort of statement about the volatility of different regimes of the underlying price, such that we might expect something akin to

if the price of the underlying is to make it above strike $K_2$ it must pass through strike $K_1$ and the (expected) volatility in these regimes might differ

Any help with understanding this is much appreciated!

$\endgroup$
3
  • 4
    $\begingroup$ BS implied volatility (the constant $\sigma$ to be clear) is nothing else than another metric in which an option price is quoted. Therefore, BS IV only makes sense when it comes a long with strike, maturity, interest rate, and so forth. It is a property closely linked to the option. $\endgroup$
    – Kurt G.
    Commented Jan 16, 2023 at 15:34
  • $\begingroup$ If the original Black Scholes theory from 1970 was perfectly true then Volatility would indeed be linked to the underlying. But it is generally recognized that it does not hold exactly in the real world and that implied vol depends on the option (the strike and maturity) that is selected to compute the implied vol. That is an empirical observation. The dependency on Strike probably comes about because of systematic changes in vol (non-constancy of vol) in different market conditions. Far away strikes (esp. on the down side) are more likely to come into play during times of heightened vol. $\endgroup$
    – nbbo2
    Commented Jan 16, 2023 at 17:53
  • 2
    $\begingroup$ Also, for each strike and maturity there is a different implied volatility. This could be interpreted as the market’s expectation of future volatility between today and the maturity date in the scenario implied by the strike $\endgroup$
    – AKdemy
    Commented Jan 16, 2023 at 18:22

2 Answers 2

6
$\begingroup$

A vol surface displays implied volatilities (IVOL) for various tenors and strikes. It can be displayed in several ways, with the two most common being:

Interest rate options are a bit different because the vol surface is a cube in a 3-dimensional space (expiry, tenor and strike). Either way, if you look at a vol surface skew, you have OTM Puts to the left and OTM calls to the right of ATM. Combined with a tenor, you have the full 3D vol surface.

Quoting from Just What You Need To Know About Variance Swaps - JP Morgan Equity Derivatives

For each strike and maturity there is a different implied volatility which can be interpreted as the market’s expectation of future volatility between today and the maturity date in the scenario implied by the strike. For instance, out-of-the money puts are natural hedges against a market dislocation (such as caused by the 9/11 attacks on the World Trade Center) which entail a spike in volatility; the implied volatility of out-of-the money puts is thus higher than in-the-money puts.

IVOL is turning an option price into a comparable number (it’s also annualized). The theory to construct IVOL is based on the world of Black Scholes (its assumptions). Black Scholes implies normally distributed stock returns, whereas real (stock) returns are negatively skewed and have fatter tails because:

  • stocks (or other underlyings) tend to move down faster than they move up, so the left side has a fatter tail than the right side - known as skewness

  • extreme price movements in both directions (called outliers) are more common than the normal distribution suggests, so both tails are fatter than a normal distribution would suggest; known as kurtosis

The intuition is the same for all sorts of markets. However, FX is very helpful in getting an understanding of it. Ignoring all details, FX is quoted in IVOL, the quotes come as ATM DNS (delta neutral straddle), RR (Risk Reversals) and BF (Butterflies). In a nutshell,

  • ATM determines the level (you can think of it as the Black Scholes IVOL for a specific tenor),
  • RR the skew (how its tilted, towards OTM puts for RUB and GBP in the examples below) and
  • BF the kurtosis (how pronounced the general wings are).

Hence, the vol surface exists mainly because there are fat tails, skewness, heteroscedasticity, jumps (crashes), and so forth. None of these real-world phenomena are featured in the Black Scholes formula. The market just developed ways to account for many of the shortcomings of Black Scholes.

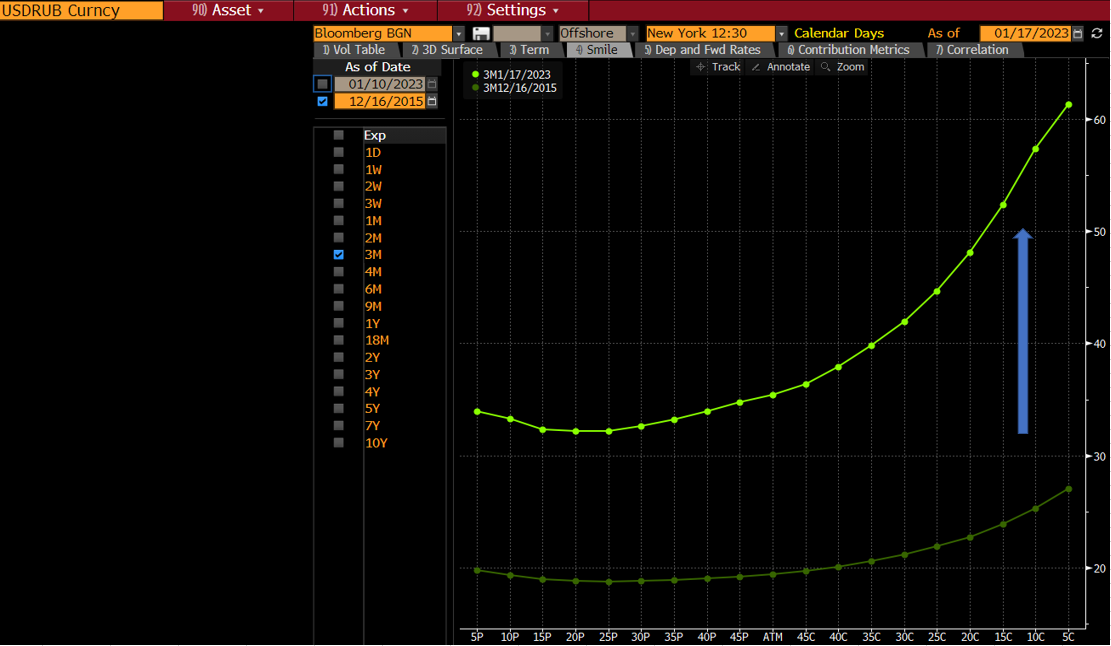
FX IVOL quotes are again a useful tool to show this. Since the Russian invasion of the Ukraine, it is more likely for the RUB to depreciate compared to the USD. If you look at a vol surface skew now, compared to a date prior to the invasion (where no one was expecting it yet), you see that the skew is a lot more pronounced now. It always existed, because the USD is generally more stable. Also, the overall level of IVOL increases too, but the main take-away is that the skew got a lot larger. To the right, we have OTM calls (on USD, which is a put on RUB, hence buying protection against a RUB depreciation is more expensive now). enter image description here

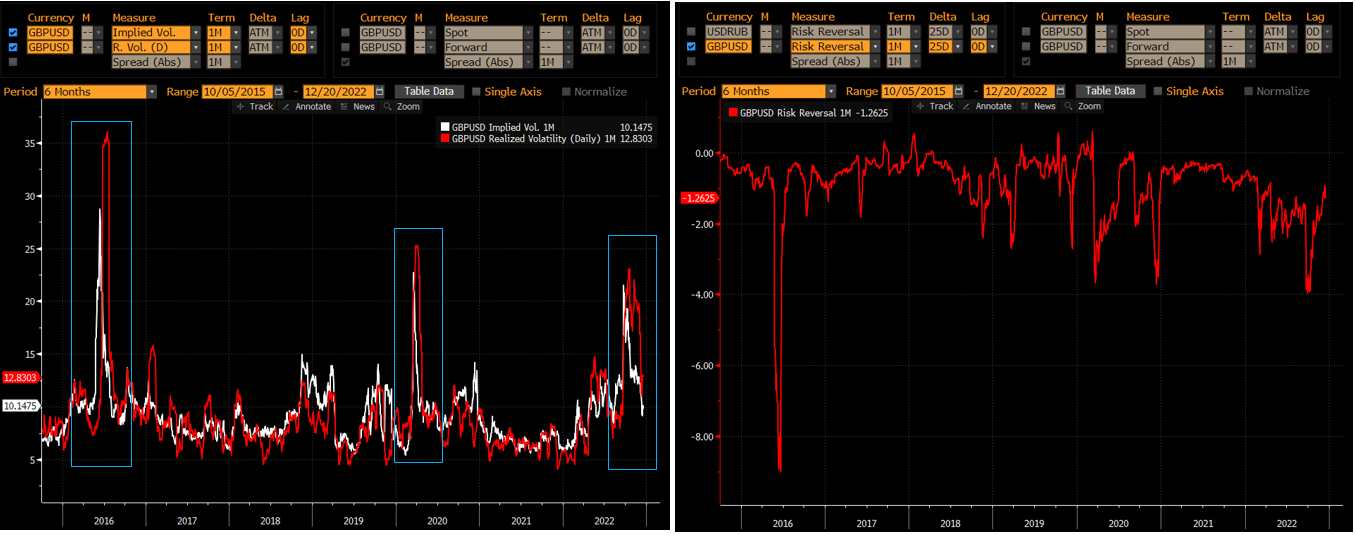
Similarly, if you look at GBP, you have Brexit as a major event. Uncertainty meant that IVOL not only anticipated the higher realized / historical vol (shown on the left screen below which is from Bloomberg's VOLC, comparing ATM 1M IVOL with realized 1M vol), but also meant that it was heavily skewed towards OTM Puts (on GBP) as displayed by the risk reversal quote over time. Realized vol takes time (1m in the example) to be computed, whereas IVOL is forward looking. That is why the spikes of the white line are before the red.

enter image description here

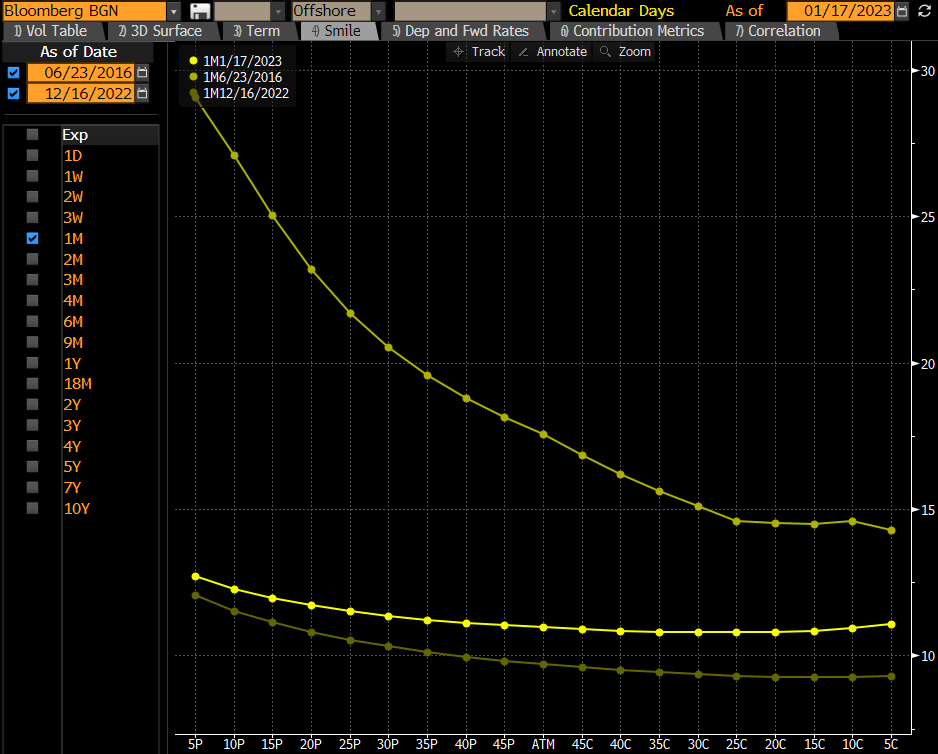
You can see that Brexit, Covid and the Russian invasion all elevated ATM IVOL (left), but the effect on the skew was a lot more pronounced during Brexit because that was a GBP specific risk. Below is a screenshot of the smile on the day of Brexit and during normal times.

enter image description here

Long story short, different IVOL for different strikes accounts for the possibility of larger outliers and skewness in the return distribution, thereby accounting for a short coming of the Black Scholes model.

$\endgroup$
1
  • 3
    $\begingroup$ Excellent answer, thank you! I think the part that goes most to my specific question is the first bit quoted from the JP Morgan document. It seems then largely that my intuition was correct in that the dependence of ivol on the strike is a statement about the underlying's expected volatility in different price regimes. The Brexit example was fascinating. Thanks again. $\endgroup$
    – OJK
    Commented Jan 17, 2023 at 16:56
0
$\begingroup$

In response to the initial question - I would argue that there cannot be a correct model. OJK says the model is unsuitable because there is no single value for volatility that produces all observed option prices. As explained by AKdemy, there are certain reasons for this, eg smile is explained by the fact that selling deep-out-of-the money options cheaply is an uncomfortable thing to do, hence OTM options trade at higher volatility

In other words, and this has been said above, supply / demand governs the price of every option indvidually, strike by strike. Assume there was an alternative option model (different from BS), which would explain all observed option prices with a single parameter, ie capture the actual option-price implied probability-neutral probability distribution of stock prices. If traders were to use this model, and demand for options of certain strikes changed, the resulting implied probability distribution might no longer be correctly described by this model. In the logic of OJK, this would again "invalidate" the alternative model. In other words, there cannot be a "correct" model.

What BS does, is provide a simplified approximation of option prices for different strikes, where smile and skew are corrections to fit actual observations. The beauty of the model lies in its analytical tractability and simplicity of underlying assumptions. This is the reason why it is still being used widely to date, and why practitioners use it, even though correction terms such as skew and smile need to be applied. Ultimately, it is a model that closely approximates prices, without being highly complex

$\endgroup$

Your Answer

By clicking “Post Your Answer”, you agree to our terms of service and acknowledge you have read our privacy policy.

Not the answer you're looking for? Browse other questions tagged or ask your own question.