12
$\begingroup$

I am trying to teach myself about interest rate swaps, how they are priced, etc... Easy enough - just comparing cash flows of fixed and floating rate bonds.

However, what I'm struggling with is how the future interest rates (as well as the discount factors) are being determined. These are never clearly explained and the articles/books simply say 'we use this term structure' or 'that term structure'.

In a more general context, my question is how do they determine with certainty (which is what the texts seem to imply) the value of something (ie the interest rate) that only materialises in the future? They never explicitly state that we use the returns (or yields) on a certain product, to predict what the interest rates might be in the future...

If my inferred understanding is correct, what they are actually doing is talking about different ways to get an estimate of what they THINK the interest rates in the future will be. The different methods being those which use for example some variant of the yield curve of zero-coupon Treasury securities, where the yield on each product with maturity T years is used as the interest rate realised in year T.

It is not immediately obvious, or explained, why these methods make sense; have they been verified empirically at some point and are now taken as granted to be true or good enough estimates?

PS: I am particularly interested in answers more closely related to industry practice as opposed to academic research.

$\endgroup$
5
  • $\begingroup$ In the process of teaching yourself, what model are you investigating? A general question will only get you general answer. $\endgroup$
    – user12348
    Commented Jun 18, 2014 at 4:56
  • $\begingroup$ @user12348 I am looking for a largely general answer. I am not investigating a particular model, but just looking at articles/texts that are supposed to teach you how to price IR swaps. $\endgroup$
    – rex
    Commented Jun 18, 2014 at 8:07
  • $\begingroup$ Price the IR Swaps using some model and then drill down into the assumptions and details. Generalities a give you false confidence and cause confusion later. But on the other hand good to know more about the topic before digging in, depends on the right perspective. $\endgroup$
    – user12348
    Commented Jun 18, 2014 at 12:26
  • $\begingroup$ Yep you are right. I will probably post another question about pricing IR swaps later :) $\endgroup$
    – rex
    Commented Jun 18, 2014 at 13:21
  • $\begingroup$ @ArmenSafieh-Garabedian, with regard to industry practice on curve building, I think Andersen & Piterbarg's book is excellent. For fair value, we do a few things in practice: a) we trace out forwards based on where we think the Central Bank is going and compare with actual forwards; we then trade on "mispricings"; b) we use econometrics techniques, e.g., regressing 10y swap rate relative to economic variables to see whether there's large divergences; c) we also use a 2- or 3-factor term structure model calibrated to historical dynamics, which then serves as the baseline for further analysis. $\endgroup$
    – Helin
    Commented Jun 19, 2014 at 14:55

3 Answers 3

17
$\begingroup$

There are two parts to your question and I'd like to answer them separately.

Curve Construction

On a daily basis, you can observe prices on a large variety of instruments, whose prices are driven by news and trading flows. Based on market prices of these instruments, there are a number of ways to create discount curves/forward curves. At a very high level (overly simplistic), what you need to do is 1) assume a functional form for the discount curve, 2) based on this discount curve, price a basket of bonds (or swaps) and compute the total pricing errors, and 3) optimize the parameters of your discount function so that the price errors are minimized.

For government markets, the most popular functional forms are cubic splines (particularly cubic b-splines), Vasicek-Fong exponential splines, and to a certain degree, the Nelson-Siegel or Svensson models. These are all extremely well documented models that you can find just by googling.

For swap markets, we also typically fit some form of a spline to the quoted LIBOR, futures, par swap rates, OIS rates and basis swaps. If you have access to Andersen and Piterbarg's "Interest Rate Modeling" (Volume I), there is an excellent chapter dedicated to "modern" curve construction techniques.

Forward Rates vs Forecasts

Simply put, forward rates are NOT good predictors of future interest rates. In fact, they are not even representative of market "expectation" of future interest rates. My favorite reading for this topic is Antii Ilmanen's "Understanding the Yield Curve."

A quick summary: Broadly speaking, the yield curve is the sum of three parts –

$$ \text{yield} = \text{expectations} + \text{bond risk premium} + \text{convexity bias} $$

1) The $\text{expectations}$ component is the market's "true" expectation for future interest rates, which may or may not be accurate forecasts of realized rates.

2) $\text{Bond risk premium}$/Term premium – Since 10-year bonds/swaps have longer duration than 3-month cash, they have more interest rate risk. Therefore, investors may demand more compensation (i.e., higher interest rate) on an ex-ante basis to be willing to take on the extra interest rate risk. This is why even if market expectation is flat, the yield curve (at least front and intermediate parts) should be a bit upward sloping.

3) $\text{Convexity bias}$ – Both bonds and swaps are positively convex; longer maturity bonds/swaps are more convex. As a result, when rates move in either direction, they'll outperform linear or negatively convex instruments. Because of this "convexity advantage," investors are willing to accept a lower yield for longer maturity bonds/swaps. This is why in the "old days," the very long end of the yield curve tends to dip.

Performing such decomposition is actually not that easy and there are a few ways to do it. But a key observation is that forward rates frequently overestimate subsequently realized rates. This is known as the "forward rate bias" and is frequently quoted as evidence of positive bond risk premium. You can see this phenomenon quite clearly in the following chart, which plots the 5-year forward 1-year rate and actual realized 1-year rate 5-years later. I should emphasize that the pattern is not always true and in fact was quite untrue in the 1970s.
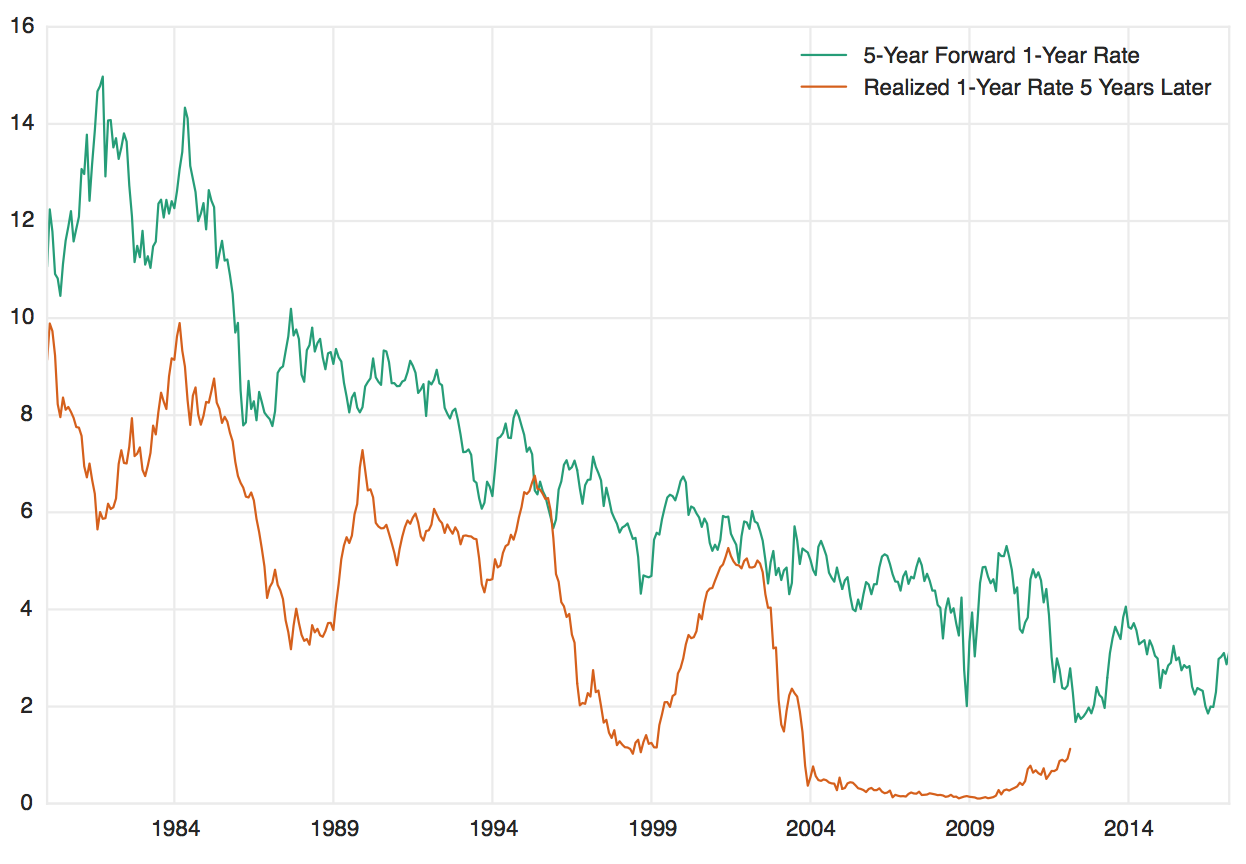
5-Year Forward 1-Year Rate and Realized 1-Year Rate 5-Years Later

$\endgroup$
8
  • $\begingroup$ Extra comment – please do not pick up the impression that bond risk premium has to be positive. In fact, it turned negative late 2011 and didn't become positive until very recently... $\endgroup$
    – Helin
    Commented Jun 18, 2014 at 19:54
  • $\begingroup$ Thanks for your answer. If I understand correctly, when I am reading these texts, they are in fact using forward rates (ie implied from T securities) as forecasts of the interest rates (ie the interest rate used to discount to PV as well as the rate of the floater). Maybe I'm just reading bad articles but I find it strange that this is not clarified. $\endgroup$
    – rex
    Commented Jun 20, 2014 at 8:54
  • $\begingroup$ @ArmenSafieh-Garabedian There are different schools of thoughts. One strategist I worked with believes these decompositions are meaningless, while I'm clearly on the other end of the spectrum. Over the past few years, equating forwards with expectations was actually quite safe, because there hasn't been a lot of risk premium priced in the curve, particularly at the front end. For a historical perspective, I dug around and found this research piece app.box.com/s/3udyrycv2wifcit7cbel. Also, I highly recommend "Understanding the Yield Curve," written by a former Salomon guy. $\endgroup$
    – Helin
    Commented Jun 20, 2014 at 14:34
  • $\begingroup$ The image link is broken. $\endgroup$ Commented Mar 8, 2017 at 15:31
  • $\begingroup$ @LuigiBallabio Thanks I've replaced the image. $\endgroup$
    – Helin
    Commented Mar 13, 2017 at 2:29
3
$\begingroup$

I don't think they are implying that future interest rates are predictable. They may be speaking of implied forward rates as predictors of future rates or, generally, of the yield curve as an expectation of the future path of short-term interest rates.

If $P(0,T_1)=1/(1+r_1)$ and $P(0,T_2)=1/(1+r_2)$ are the prices today of two "risk-free" zero coupon bonds maturing at $T_1 =1$ year and $T_2 =2$ years, respectively, then we know with certainty the interest we recieve if held to maturity. What we don't know is if it will be better to buy the 2-year bond or buy the 1-year bond and roll into another 1-year bond at maturity. The 1-year forward rate embedded in these prices is

$$f(0,T_1,T_2)= \frac{P(0,T_1)}{P(0,T_2)}-1.$$

That is the future 1-year zero-coupon rate that makes an investor indifferent between the two strategies:

$$1+r_2= [1+r_1][1+f(0,T_1,T_2)]$$

There are three principal yield-curve theories: Pure Expectation, Liquidity Preference and Market Segmentation. These are used to explain (not necessarily predict) the shape of the yield curve. At best the models are trying to find an unbiased expected future term-structure around which the random fluctuations will be centered. As with all theories of finance there are limitations.

With research reports from sell-side banks, the Federal Reserve, independent economists, etc. there is a plethora of interest rate forecasts by month, quarter, year etc. All I can say is I know a study that examined the success of the forecasts from a major survey conducted annually in the financial press with a decades long history. The study showed that the success rate of the forecasters just predicting the DIRECTION of the change in the UST 10-year rate was less than 50%.

From a short-term investing perspective, trying to predict interest rate changes is, more or less, a coin toss. There are characteristics like mean reversion and short-lived anomalies in the shape of the term structure that are better to pursue.

$\endgroup$
1
$\begingroup$

How are the future interest rates determined? Two ways. 1) They are observed in the market, i.e. they are the best estimate of the market participants. One way is to use Bloomberg. 2) You can create your own discount curve and from that calculate the forward rates. Discount and forward curves for non-collateralized swaps must be consistent, otherwise arbitrage is possible. Note how 1) and 2) relate. You can observe in 1), but you have to be consistent with 2).

How "certain" are these future estimates? They are not. Goldman Sachs, in one of their pitches to my client, has beautifully shown how forward rates constantly overestimate the actual rates. Note that the estimate of forward rates, as observed in the market, change on a second-by-second basis.

How to derive interest rates? You, without Bloomberg or Reuters, cannot do it. You can see Libor rates online (1Y), you can see futures prices (1-3 years), but for everything beyond you need Swap prices. These are determined by trades between majore banks, unless you have a subscription to that data, I don't think this is publicly available information.

What else plays a role in determining interest rates? With all the theory of Hull and Co. interest rates, like any other price, are determined by the whims of players. I had a client who entered into 17 swaps (total 4bn USD) with 8 banks. Every single bank gave him different rates. This was in 1 day. Reason? One bank didn't care about future busines, one bank wanted the IPO, other wanted all derivatives business in the future.

Another issue is - every major bank has their own model to determind the curves (discount and forward). They have to somewhat similar, but algorithms differ.

Last, but not least, we haven't even touched on OIS. Whole different game.

$\endgroup$

Your Answer

By clicking “Post Your Answer”, you agree to our terms of service and acknowledge you have read our privacy policy.

Not the answer you're looking for? Browse other questions tagged or ask your own question.