1
$\begingroup$

Note : We are considering the case of N risky assets.

I think the answer is 'Yes', although I am not sure as I am unable to prove it.

The reasons for me thinking that the answer is 'Yes' are -

1) The two portfolios being considered are efficient, so they obviously lie on the efficient frontier.

2) We know that the linear combinations of any two portfolios form a parabola in the E-V space. So as a special case, the linear combinations of the two efficient portfolios being considered by us will also form a parabola in the E-V space.

3) The Efficient frontier for N risky assets is also a parabola in the E-V space.

4) So the only way the answer to my original question is 'No' is when the parabolas in (2) and (3) are not the same, which I think won't be possible geometrically.

(I think so because if the parabola in (2) is different than the one in (3), it will have to be below the one in (3), so that it stays in the efficient frontier, but at the same time pass through the two efficient portfolios being considered.)

$\endgroup$
4
  • 1
    $\begingroup$ Although I don't have a reference, I believe it has been proved in Portfolio Theory that the efficient frontier can be generated by linear combinations of two portfolios on the efficient frontier. $\endgroup$
    – Alex C
    Commented Jan 29, 2019 at 16:11
  • $\begingroup$ @Alex C, even I remember reading somewhere that it has been proved. But I am not sure. Please upvote the question so that it gets some traction. If we aren't sure about the answer, I think it deserves it. $\endgroup$ Commented Jan 29, 2019 at 16:41
  • 1
    $\begingroup$ This is known as the Two Fund Theorem and there is a proof here mycourses.aalto.fi/pluginfile.php/554618/mod_resource/content/5/… $\endgroup$
    – Alex C
    Commented Jan 29, 2019 at 16:45
  • 1
    $\begingroup$ To split hairs, when we say "cover the efficient frontier", we mean "can achieve the mean and volatility of any point on the frontier." Obviously, if the covariance matrix is rank deficient, the portfolios on the efficient frontier could be described as the linear combination of $k>2$ different portfolios. $\endgroup$ Commented Apr 9, 2021 at 17:20

2 Answers 2

1
$\begingroup$

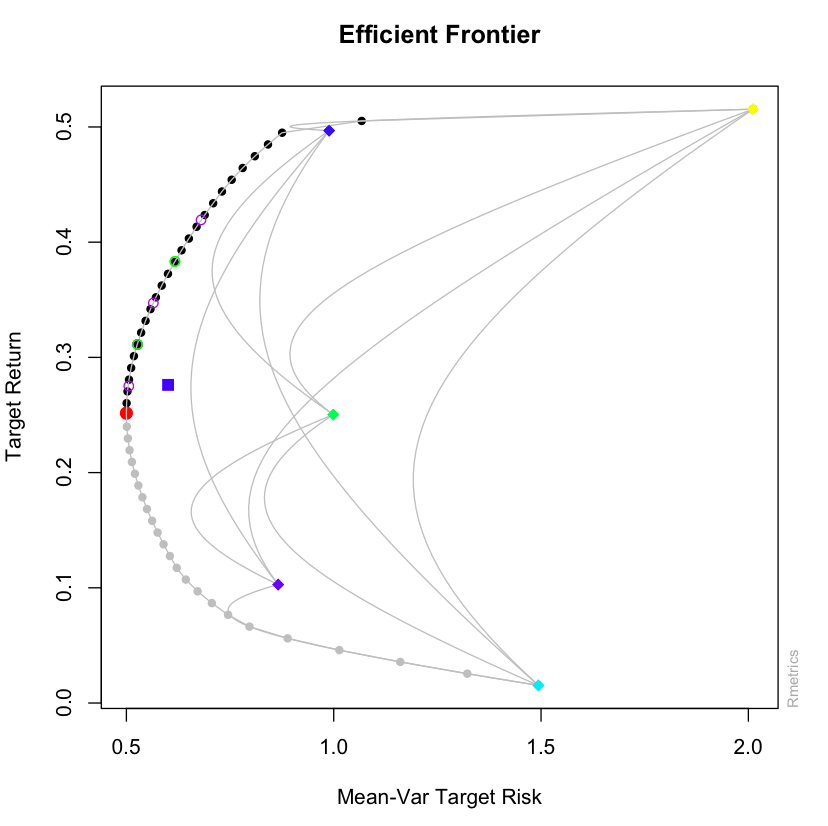
Here is an example for five stocks: The black concave is the efficient frontier as estimated in R.

I have by the power of my brain conjured two portfolios that always seem to lie on the efficient frontier. These are the green circles on the efficient frontier. I have then computed linear combinations of the two efficient portfolios marked by purple circles. The interior purple circle (between the two green circles) is a positive linear combination of the two portfolios (both long 50%). The exterior purple circles are long one of the green circle portfolios and short the other (the sum of their shares adding up to 1). All linear combinations lie on the frontier.

Efficient frontier as optimized in R (black full circles), efficient portfolios as conceived (green empty circles), and linear combinations of the conceived efficient portfolios (purple empty circles)

Regards, Dan

$\endgroup$
0
-1
$\begingroup$

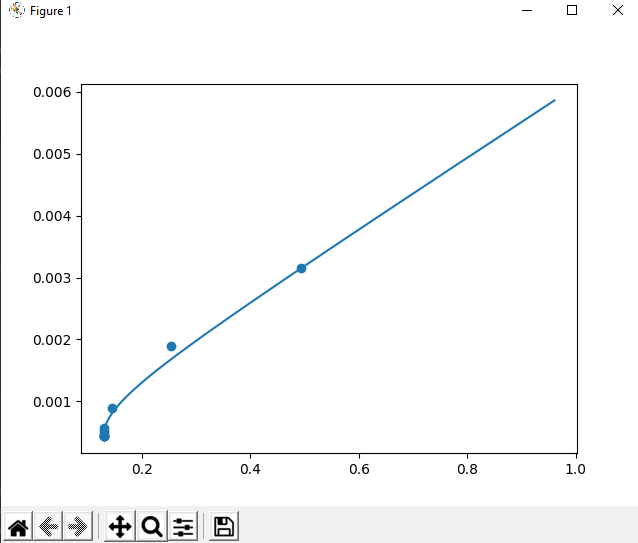
I am not a math guy but I tried to plot the efficient frontier using the linear combination between the global min var portfolio and another efficient portfolio and I have this result:

Efficient frontier with efficient portfolios

Points represent efficient portfolios from variance minimization given a target return

The linear combination looks more like an approximation

$\endgroup$
1
  • 1
    $\begingroup$ It is mathematically proved that you can trace out the frontier by combining the GMVP and another portfolio, so there must be something wrong with your example, calculations or graph. $\endgroup$
    – nbbo2
    Commented Apr 10, 2021 at 1:51

Your Answer

By clicking “Post Your Answer”, you agree to our terms of service and acknowledge you have read our privacy policy.

Not the answer you're looking for? Browse other questions tagged or ask your own question.