Long time viewer, but first time poster, so excuse me if i'm in the wrong place please.
Anyway, I am working on a project that is pretty interesting. Through data mining, I am able to gather a ton of investment portfolios. Each portfolio has the obviously related statistics, including total revenue, total loss, resulting profit, and I can even get a daily break down of this for the past 3-4 years. (1200 days exactly).
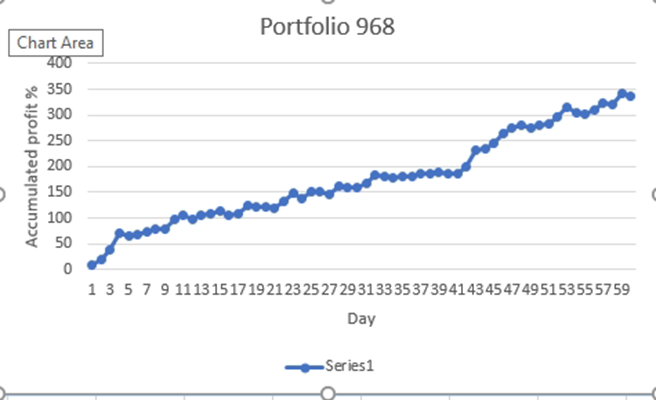
I did a bit of excel manipulation, using the r2 pearson function and using a sharpe ratio (average profit/standard deviation), and I think I am on the right track because I was able to get a few results that were pretty damn consistent. First I break up the 1200 days into 20 day segments, and I get the net daily profit/loss. Then I accumulate the 60 points of 20-day intervals to get a growing summation. When you do this, you'll get some sort of line since you're adding up the individual intervals, and then I apply the 2 functions of r2 pearson and sharpe ratio to this line. My goal is to find portfolios that are linear in fashion, because in my eyes, if the portfolio has been linear for the past 1200 days, it should have a high chance of continued linearity.
So when you sort out my list of portfolios by highest sharpe ratio, I can choose one of the top portfolios and as you can see from the pic of the graph attached, it is somewhat consistent and linear as opposed to another portfolio that, when graphed, appears to be sinusoidal, or erratic with large jumps and dips.
My question is, can anyone give me more information on how valid my theory of using linearity for continued success is? Is there a different equation that I should be using to determine which portfolio I can invest with in the future? Is there something more capable of defining linearity of my portfolio graphs than the r2 function or the sharpe ratio?
I was also thinking of using a portfolio that ranks high in =(average sum)/(loss)) or choosing a portfolio that has the least amount of losses in it. Typically though, I have observed those having alot of flat areas when graphed, and I'm not sure that would be best for future success.
Thanks!!
Updated (1/25/2021)
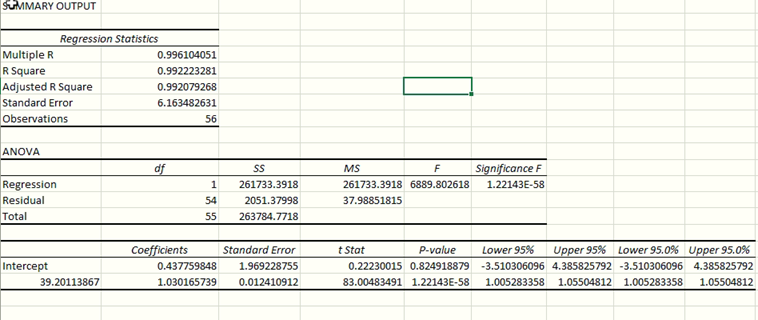
Below is a regression analysis done via excel using toolpak. I know the p-value is important, but is there anything in here that says this is terrible?

