I am currently hedging a short put option where strike is 6027 and expiry is 30th Mar 2023. As per my understanding when option is ITM increase in volatility will decrease the delta and decrease in volatility will increase the delta, whereas for OTM option increase in volatility will increase the delta and decrease in volatility will decrease delta. For the above mentioned put option, when the spot is 6200 i.e. the option I have selected is OTM. So any increase in volatility should increase the delta. But I have observed that when IV is between 0-34% any increase in IV does increase delta but when I increase the volatility from 34% to 37% for example the option delta decreases even though the option is OTM. What can be the explanation behind this behaviour? Or does delta behave differently when volatility is higher?
2 Answers
In the Black-Scholes-Merton model, with model option price $V$ as a function of underlying price $S_t$, strike price $X$, continuously compounded risk-free rate $r$, continuously compounded dividend yield $y$, time-to-maturity (in year fractions) $\tau$ and implied volatility $\sigma$, our $\Delta$ is defined as
$$ \Delta\equiv \frac{\partial V}{\partial S_t}=e^{-y\tau}\mathrm{N}\left(d_1\right) $$ with $$ d_1\equiv \frac{\ln S- \ln X +(r-y+\frac{1}{2}\sigma^2)\tau }{\sigma \sqrt{\tau}} $$
Let $B\equiv Xe^{-r\tau}$ the discounted strike and $\tilde{S}\equiv Se^{-y\tau}$ the 'yield-discounted' spot price, then
$$ \begin{align} \frac{\partial \Delta}{\partial \sigma}&=e^{-y\tau}\mathrm{n}\left(d_1\right)\left(\frac{\partial d_1}{\partial \sigma}\right)\\ &=e^{-y\tau}\mathrm{n}\left(d_1\right)\left(\frac{1}{2}\sqrt{\tau}-\frac{\ln \tilde{S} - \ln B }{\sigma^2\sqrt{\tau}}\right) \end{align} $$
As $\mathrm{n}\left(d_1\right)> 0$ whenever $\sigma\sqrt{\tau}>0$, the sign of the change in $\Delta$ as a function of $\sigma$ depends on whether
$$ \frac{1}{2}\sigma^2\tau \lessgtr\ln \tilde{S} - \ln B $$ i.e. whether the (logarithmic) moneyness is within 1/2 of the term variance. HTH?
Not sure if you meant only short puts with "when option is ITM increase in volatility will decrease the delta, whereas for OTM option increase in volatility will increase the delta". Either way, you cannot generalize it like that as you figured out yourself.
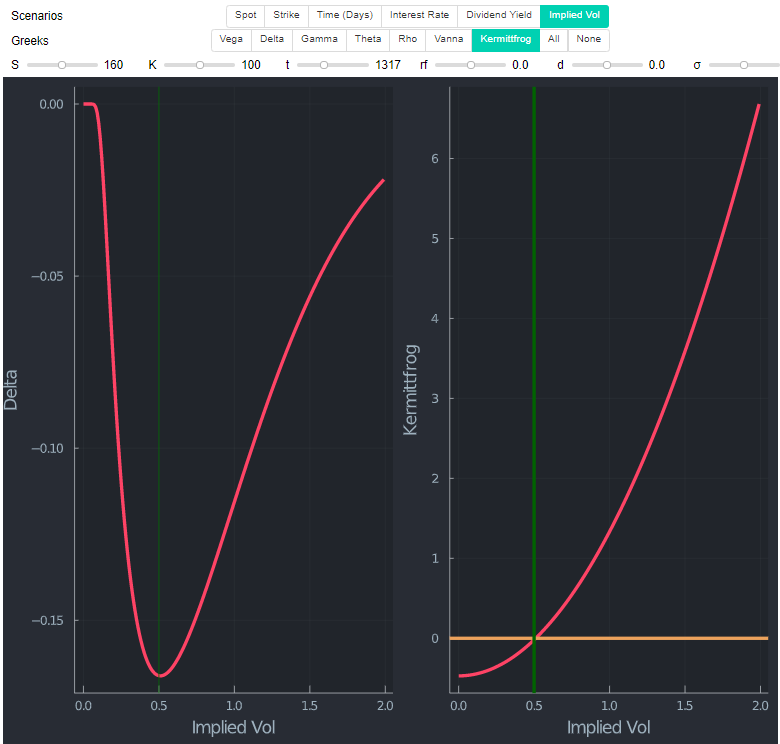
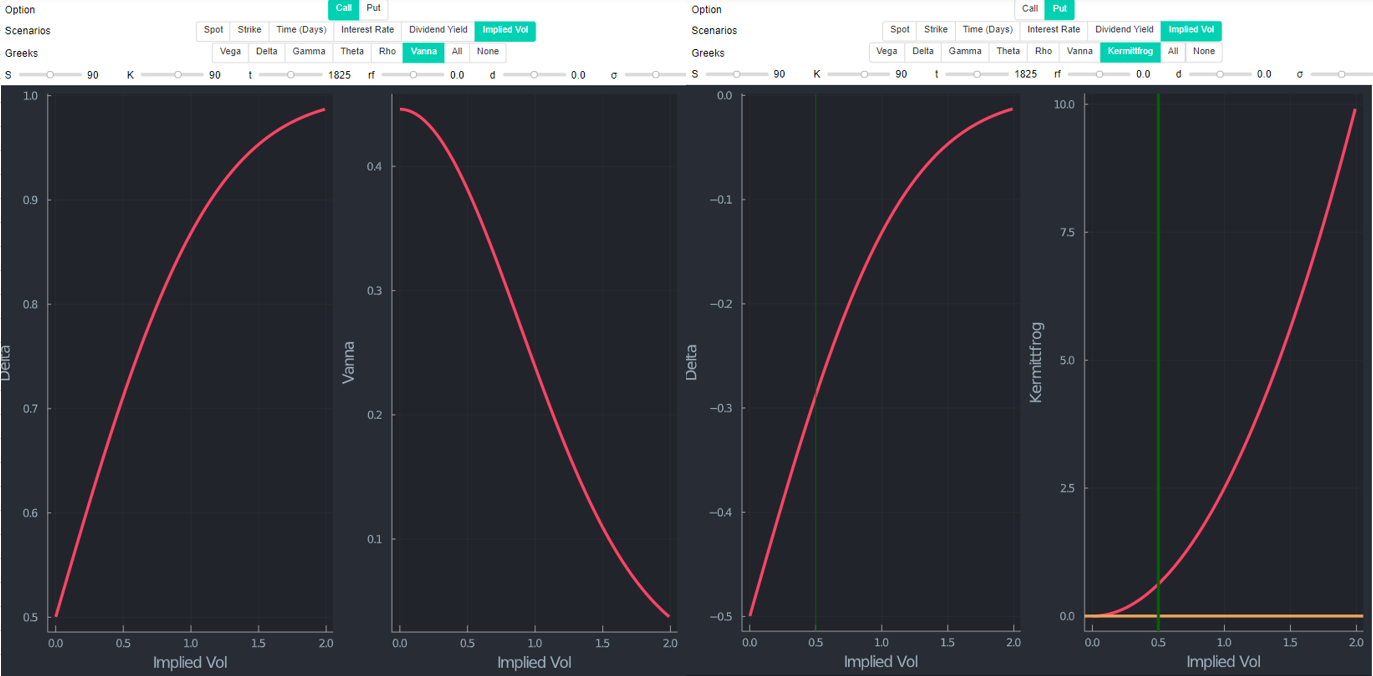
Adding a few remarks to @Kermittfrog's excellent answer. If you plot delta and the condition derived by Kermittfrog as a function of vol you can clearly see the relationship. The right-hand side in the plot below is Kermittfrog's condition $1/2*σ^2*t - log(S/K)$. The yellow line determines if the change in $\delta$ is positive or negative as a function of $\sigma$ (in this specific example of being long an OTM put). "Kermittfrog indicator" below 0 means declining delta and vice versa. The green vertical lines are just for convenience to show that it is indeed the minimum of $\delta$ where its sign changes (left-hand side). The charts below are produced with Julia.
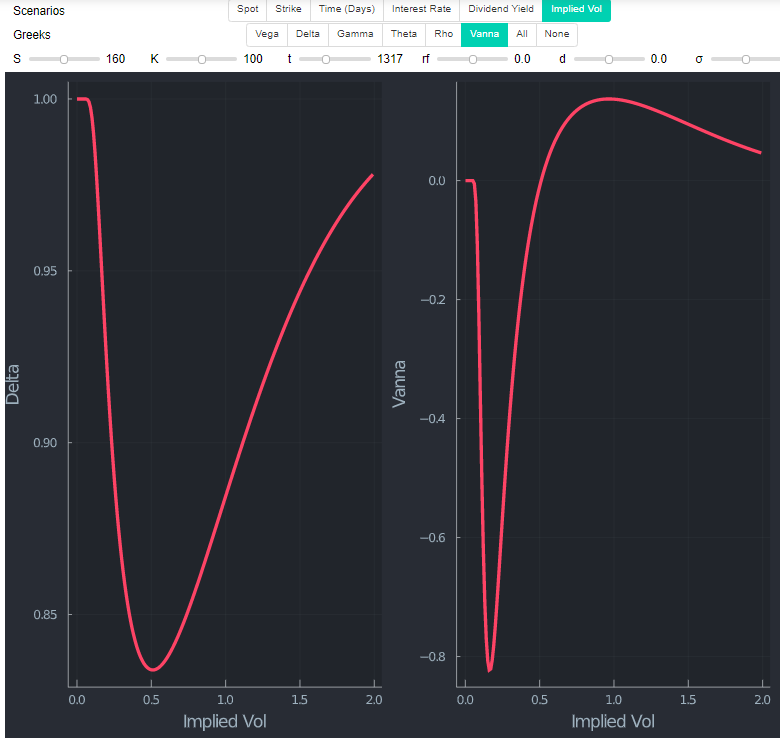
Looking at a call with the same strike (hence ITM now) shows that $\delta $ is looking similar in shape (not in actual values obviously). I added Vanna (dDeltaDvol) which measures the rate of change of delta concerning changes in Vol for convenience in this chart.
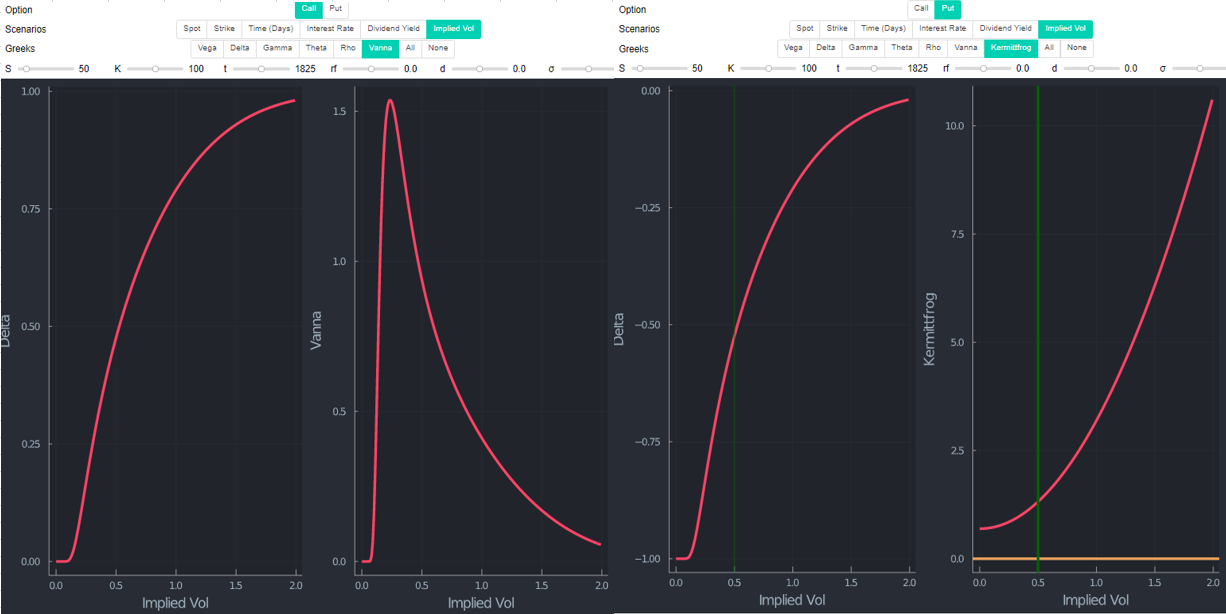
However, neither OTM call nor ITM put exhibit this pattern. Also natural, given $1/2*σ^2*t - log(S/K)$ depends on the second term (all else equal). When $S=K$, $log(S/K)=0$. Once $S<K$, $log(S/K)$ is negative. Hence, both terms are strictly positive (you subtract a negative value) and vol is positive in any case.
Why? A common explanation that I think could be the one you base your understanding on is explained here (slightly modified by myself):
- An OTM options payoff is zero if it would expire today (completely worthless):
Rising vol (or more time) increases the probability of the option ending up ITM (it may well remain OTM or become more OTM but because of the non-linear hockey stick payoff, the downside is not a major concern). Hence, changes in the underlying are beneficial and more vol increases delta. Note, this only holds for long OTM calls, as we have just seen that long OTM puts do not follow that logic - but delta decreases (in your example you are short, which changes the sign).
- An ITM option payoff would already be positive if it would expire today:
Rising vol (more time) increases the risk of the underlying moving against you. Hence an increase in vol will increase the probability for zero payoffs from a shift in the underlying price (delta decreases).
Now, if you read that a few times you will realize the flaw in this argument. If an OTM options delta benefits from vol because it could become ITM; but if it were ITM it would be a disadvantage; how can it ever be an advantage? Furthermore, it is the opposite for puts and even reverses (for OTM puts and ITM calls) once vol reaches a certain threshold.
Get some definitions and observations
Before providing an answer, I need to define a few things. The next paragraph closely follows the paper of Lars Tyge Nielsen.
In Black Scholes, stock prices $S_t$ at time t follow a lognormal distribution. At time 0, $$log(S_T) \sim \mathcal{N}(log(S) +(\mu -\sigma^2/2)t, \sigma^2t)$$
To be precise about $\mu$ and $\sigma^2$ we need to make a few observations about the rate of return of the stock. The continuously compounded rate of return over an interval $[0,t]$ is $$\frac{log(S_t)-log(S)}{t}$$
Given the current stock price $S$, this rate follows the normal distribution $$\mathcal{N}((\mu -\sigma^2/2),\sigma^2/t) $$
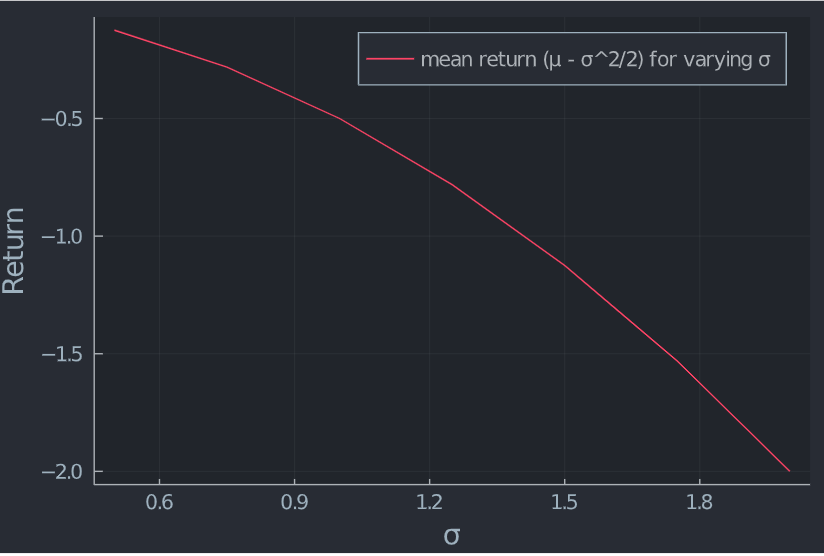
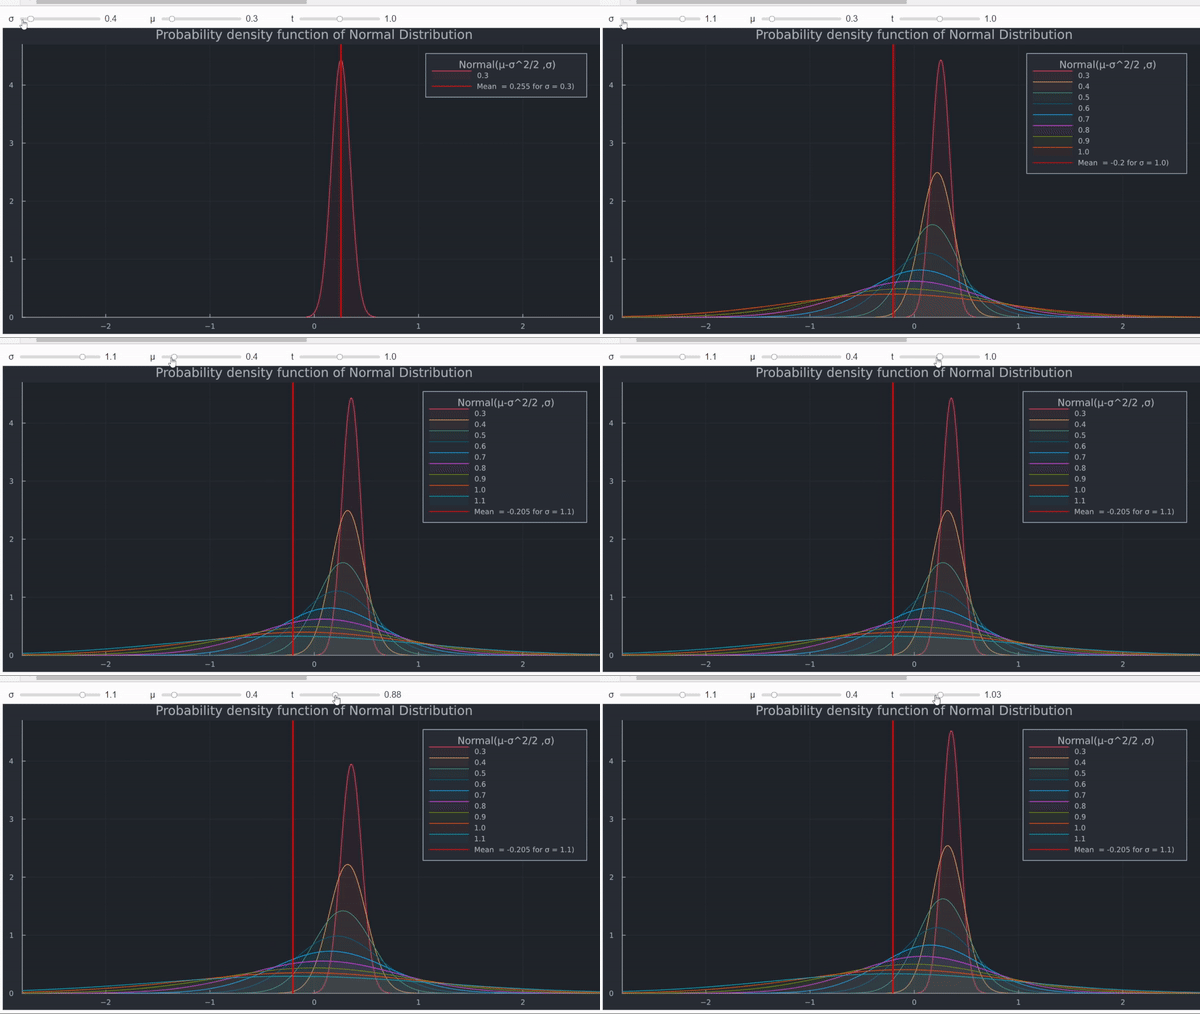
In plain English, its logarithm is normally distributed with mean $(\mu -\sigma^2/2)$ and variance $\sigma^2/t$. As $t$ grows, variance decreases towards zero, whereas the mean of the rate of return does not depend on time $t$. However, the mean depends on volatility. The chart below shows this relationship for a unit interval ($t=1$).
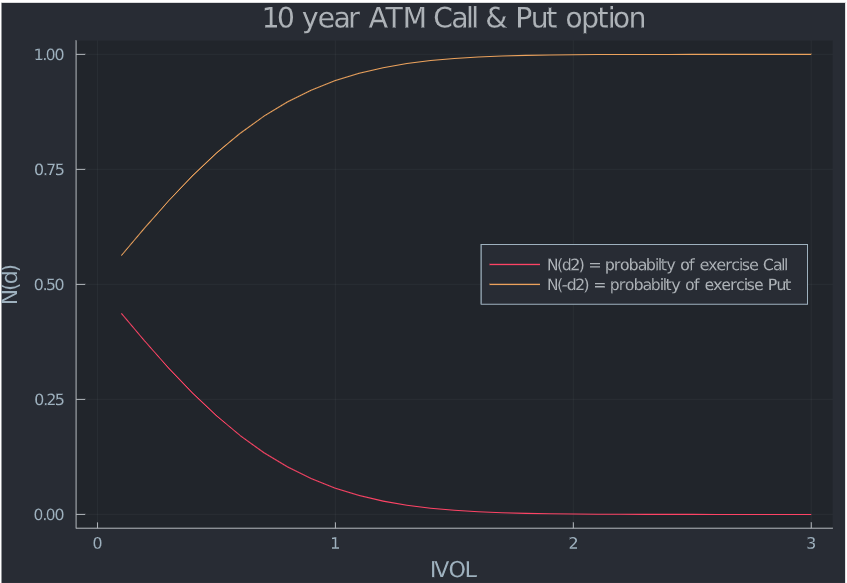
Almost there, no worries. $N(d2)$ is the probability that a call option with an exercise price of $K$ is exercised in a risk-neutral world. Therefore, $(1− N(d2)$ or $N(-d2)$ is the probability that a put with the same exercise price will be exercised. Let's plot this as a function of vol.
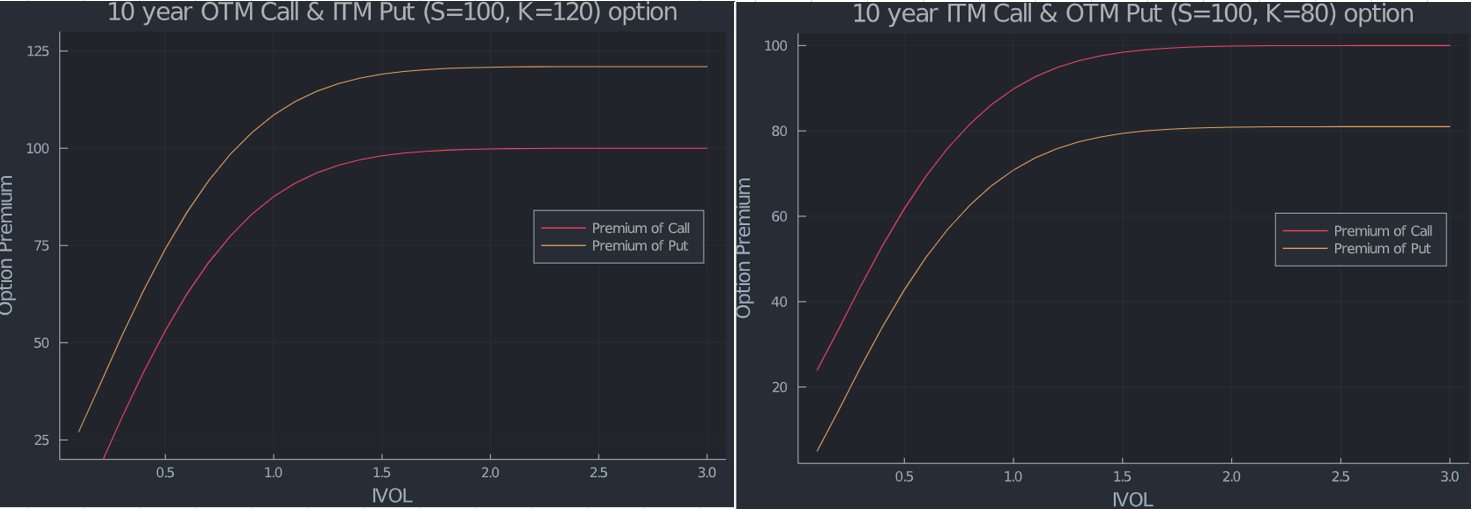
How about the premium of puts and calls?
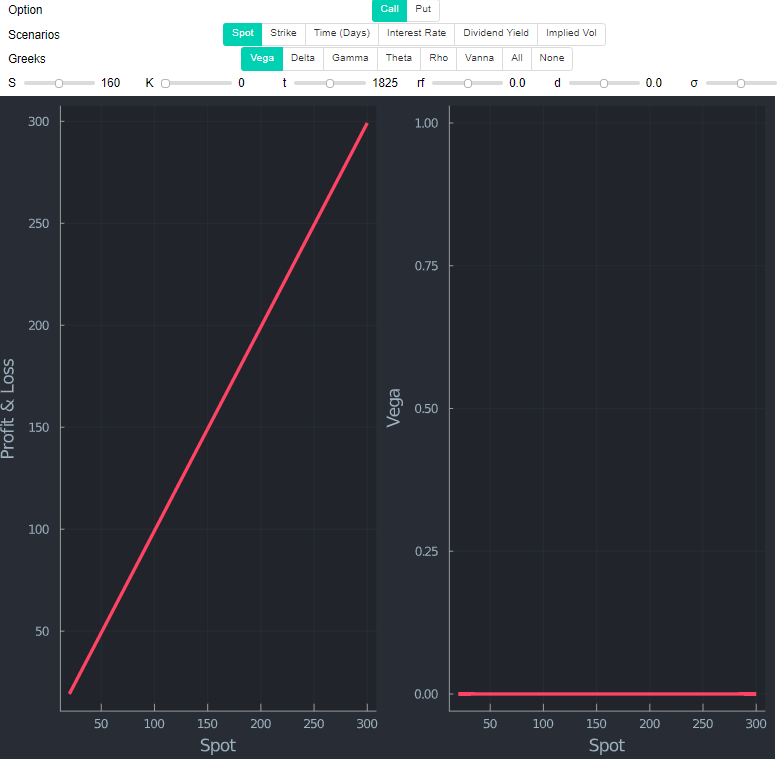
Getting stranger and stranger isn't it? Even though there is supposedly zero probability of exercise for a call, I still pay a maximum that seems to be the current spot price, irrespective of the strike. I will provide another explanation using $N(d1)$ a bit further below after the PDF of the normal distribution. For the put, however, the maximum is reached at the strike price itself. Explained intuitively, a zero strike call has no vega and does not change when vol is increased to infinity.
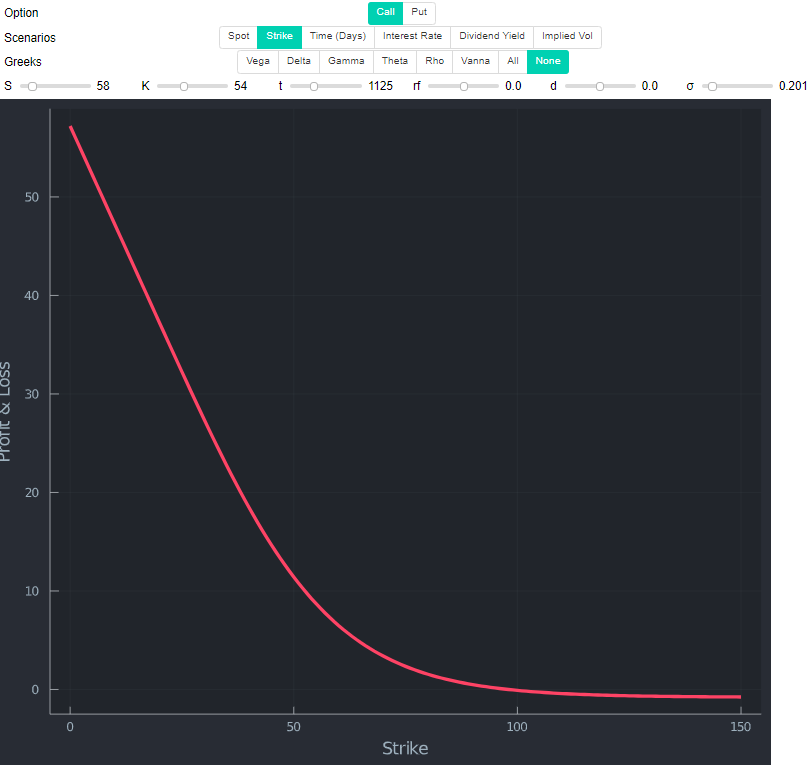
At the same time, call option prices are decreasing, as a function of strike (see next chart). Thus, the maximum value a call option can have is that of the zero strike call (which is the price of the current spot when there are no interest rates and dividends). For puts, a similar argument can be made that leads to the strike being the maximum value. I link an answer/explanation where the question is flawed (delta is not the probability of exercise) but the accepted answer is correct.
However, how can this all make sense?
I'll link another answer explaining why the value of call option reaches this maximum (spoiler, the question is again flawed, as is the accepted answer itself, but the unaccepted answers are correct. Intuitively, the answer by @Jesper Tidblom is appealing (to use some computer code to demonstrate).
"Although the probability of ending up in the money goes to zero, a larger and larger proportion of the expected value of $S_T$ comes from that region. More and more contribution of the expected value come from values of $S_T$ when $ST≥K$ as $σ$ grows, although the probability for those values to occur goes to zero. So we have a sort of competition of limits here where the values of $S_T$ above $K$ increases faster than their probability to occur goes to zero, so to speak."
This vaguely reminded me of Cantor's diagonalization proof in set theory (silly side remark to an already too long answer, sorry).
It all pins down to this answer. "All else equal, increasing vol results in the distribution trying to extend itself on both sides of the definition domain but hits a boundary at zero, where probability accumulates (probability mass)".
Let's run some code to demo this:
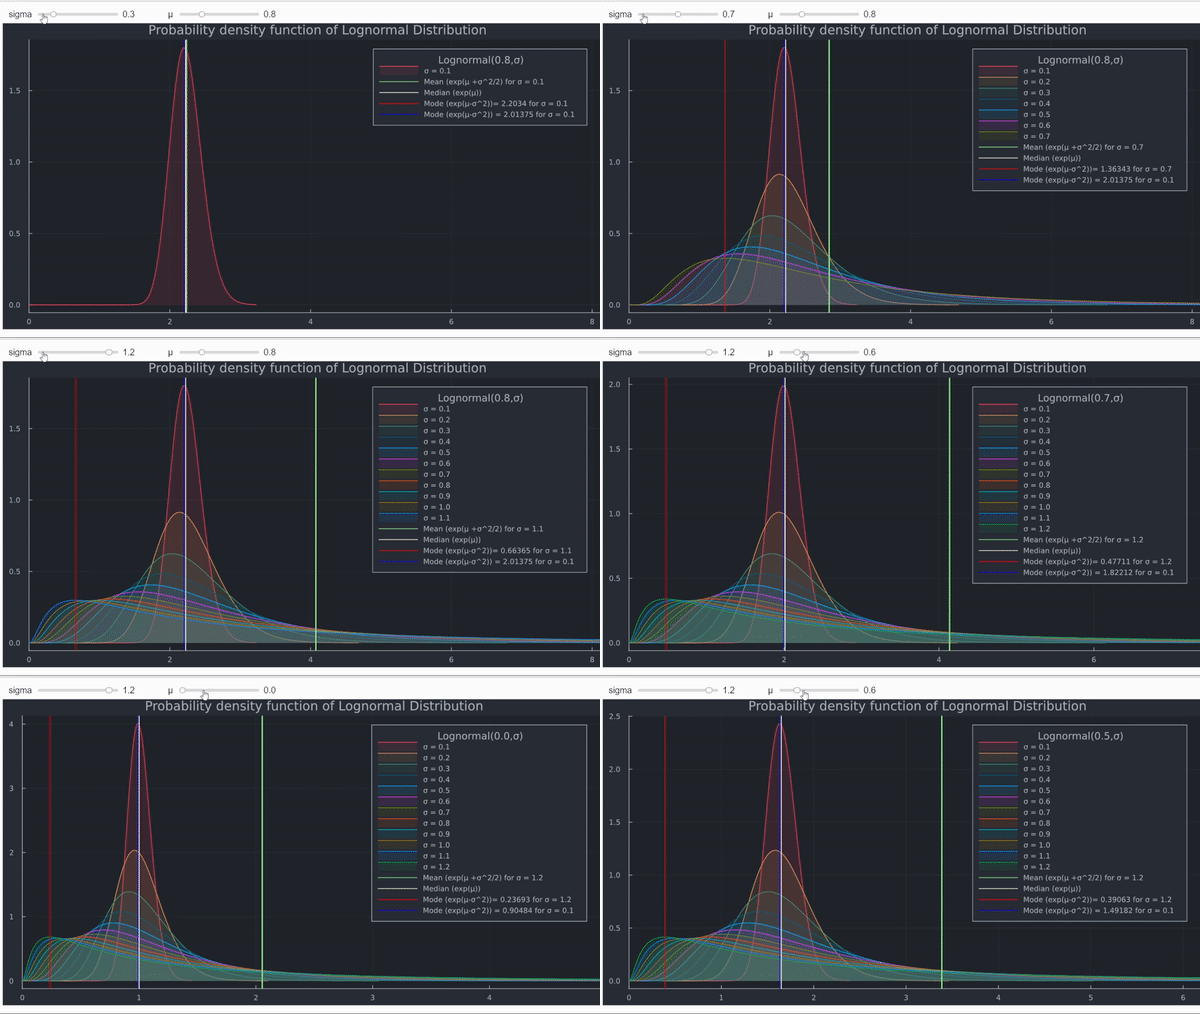
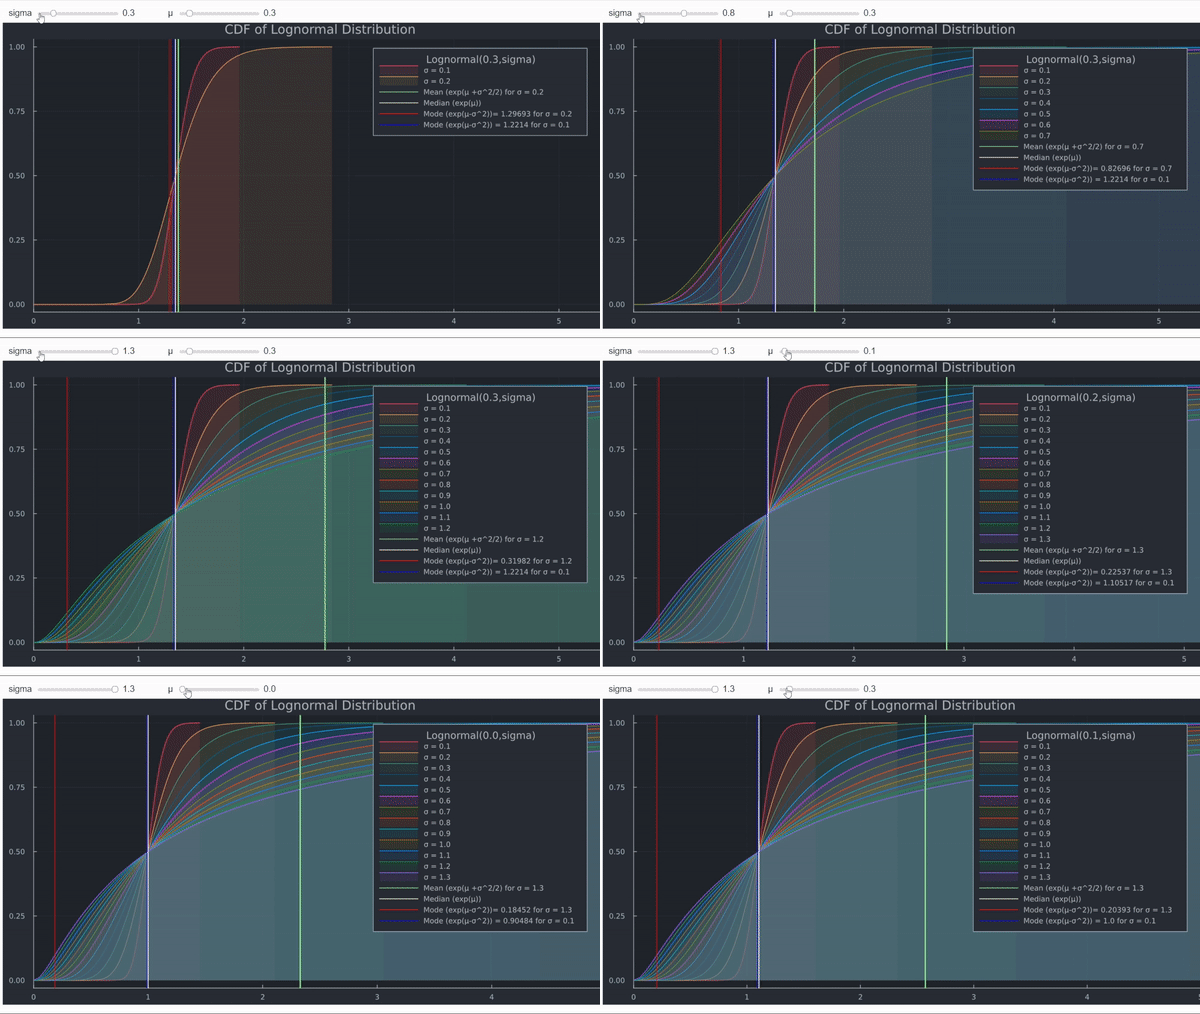
The higher $\sigma$, the more the global maximum of the probability density function (the mode) shifts towards the lower bound of the lognormal distribution, and the cumulated distribution function (CDF) shows the increase in the probability of $S_T$ being very small. Therefore, the probability of exercise for a call eventually becomes zero.
Also, as seen above, expected returns decrease. This can also be demonstrated by plotting the normally distributed returns.
At the same time, the expected value of $S_T$ (the mean) grows (check out the green vertical line in the PDF above). $N(d1)$ multiplied by the current stock price and the riskless compounding factor represents the expected value, computed using risk-adjusted probabilities, of receiving the stock at expiration of the option, contingent upon the option finishing in the money. That is another explanation (before I used zero strike call) why a call option (with zero rates and dividends) has the spot price as its maximum value.
These are the two forces at play here.
- If you are long ITM calls or OTM puts, $$\frac{log(\frac{S}{K})}{\sigma\sqrt t}$$ is positive but converges to 0 as $\sigma \rightarrow \infty$
- Convexity adjustment in Black Scholes is represented by (omitting rates and dividends) $$ \frac{\frac{1}{2}\sigma^2(t)}{\sigma\sqrt t}$$
The latter term is related to the so called Volatility Tax. When vol is very small, the former is the determining factor and you essentially observe the hockey stick. If vol grows, the difference between S and K becomes negligible but the expected value of $S_T$ continuous to increase which lifts the time value of the option to the extent that the payoff is eventually almost linear.
Ultimately, limits can be a strange thing. Warren Buffett explained his take on the Black Scholes formula for long-dated options in his 2008 letter to the Shareholders of Berkshire Hathaway. "The Black-Scholes formula has approached the status of holy writ in finance, and we use it when valuing our equity put options for financial statement purposes. ... If the formula is applied to extended time periods, however, it can produce absurd results. In fairness, Black and Scholes almost certainly understood this point well."
For completeness sake, ATM can be found below. Since $log(S/K)=0$ if $S=K$, it is clear that the only term remaining in Kermittfrog's "indicator" is the vol term, which is always positive.
If you managed to read until here, props! There will almost certainly be typos and potential errors. I did this for fun and out of personal interest. Nonetheless, I think it may help others. Feel free to correct errors or leave comments if something is wrong.

